Latest news about Bitcoin and all cryptocurrencies. Your daily crypto news habit.
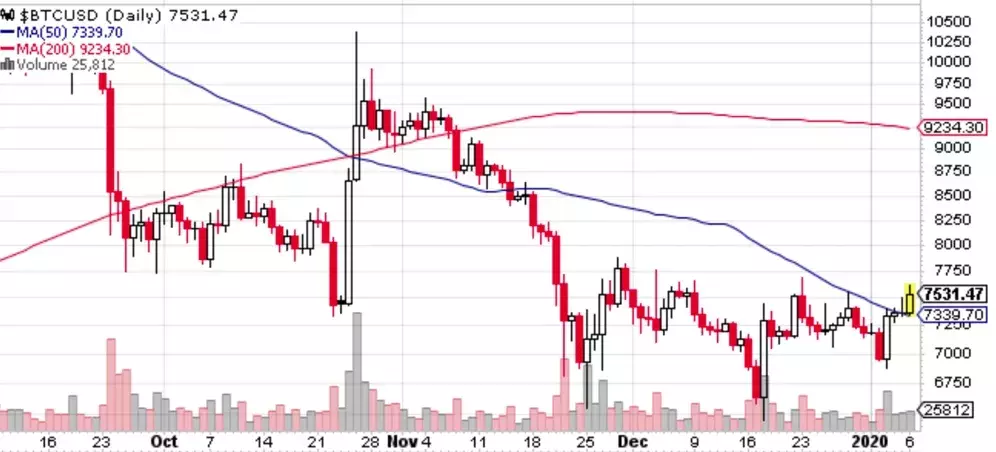
BTC/USD has a 52-week low of $3,360.75 and a 52-week high of $13,829.07. Based on current price movements in 2020, Bitcoin is trading around $7,531.47 – substantially lower than the 200-day moving average of $9,234.30, but marginally above the 50-day moving average of $7,339.76. The wildly fluctuating prices of Bitcoin can whipsaw dramatically from one moment to the next; a testament to the volatility of this asset category. Already 18.07 million BTC are circulating in the markets, with a cap of 21 million. Trading the news with Bitcoin requires an understanding of charts and technical indicators. These can prove beneficial with respect to buying and selling Bitcoin CFDs. One such indicator is the 50-day moving average. This is reflective of short-term sentiment, with bearish movements in recent months. Several important statistics lend credibility to the decisions taken by traders, notably:
- 1-year performance of BTC → + 86.63%
- 3-month performance of BTC → -8.23%
- 1-month performance of BTC → +2.24%
While generally positive, the data points towards large-scale selloffs in recent months. As for the overall health of BTC, it has garnered a score of 897/1000; placing it clearly in the healthy zone for cryptocurrencies, despite its fluctuating performance.
Technical Factors: Bitcoin Bollinger Bands and MACD
 Source: Markets Insider BTC USD Bollinger Bands
Another important indicator, Bollinger Bands reveals interesting data about current price movements with Bitcoin. The upper Bollinger Band is higher than the prevailing price of Bitcoin. This indicates that Bitcoin is overbought and a price correction to the downside is likely. The median band is approximately 2% lower than the prevailing price, and the lower band is over 5% lower, all of which point to a downward revision in the price of BTC. As a Bitcoin CFD trader, it is clear that momentum will shift to the downside with an increased likelihood of sell contract options.
 Source: MarketWatch Bitcoin MACD
Moving Average Convergence Divergence (MACD) figures in January present some interesting findings. The MACD is determined by subtracting 26-period EMA (Exponential Moving Average) from the 12-period EMA. This gives rise to the signal line, as displayed above. The current signal line is 53.63, with the MACD of 7, and the MACD historical reference of 46.63. When reading BTC/USD MACD data, traders look for crossovers.
The 12-Day EMA can either be above or below the 26-Day EMA. If the 12-Day EMA is above the 26-Day EMA, then the bulls are out and this presents as a buy signal. If the 12-Day EMA falls below the 26-Day EMA, the bears are mauling and this presents as a sell signal. Once again, crossovers must be found to make MACD indicators useful for Bitcoin CFD trading purposes. Graphs and charts are the best tools to use to determine when bullish or bearish periods of trading exist.
Using Indicators to Make Informed Bitcoin Trading Decisions
Recall that the signal line is but one of three components of MACD indicators. The others include the MACD line, and the histogram. When the MACD line rises above the signal line, it is a buying opportunity for Bitcoin CFD traders. However, when the MACD line crosses below the signal line it becomes a bearish indicator. This technical indicator is important insofar as it indicates the presence of trends that are developing in the market.
The short-term trend (12-Day EMA) is measured against the longer term 26-Day EMA trend, to determine relevant price movements. Much like the Bollinger Bands, MACD technical indicators are perfect for identifying overbought and oversold markets. When the gap between the lines is at its maximum, significantly above the zero line, markets are overbought. When the gap is substantially large to the negative side, the BTC market is oversold. Both of these extremes indicate movements in the opposite direction are likely to follow.
A caveat is in order: Bitcoin prices can fluctuate wildly and it is important to limit the size of individual trades to protect your trading budget. CFD trading is particularly volatile, and is not advised for risk-averse traders.
Publication date
Disclaimer
The views and opinions expressed in this article are solely those of the authors and do not reflect the views of Bitcoin Insider. Every investment and trading move involves risk - this is especially true for cryptocurrencies given their volatility. We strongly advise our readers to conduct their own research when making a decision.