Latest news about Bitcoin and all cryptocurrencies. Your daily crypto news habit.
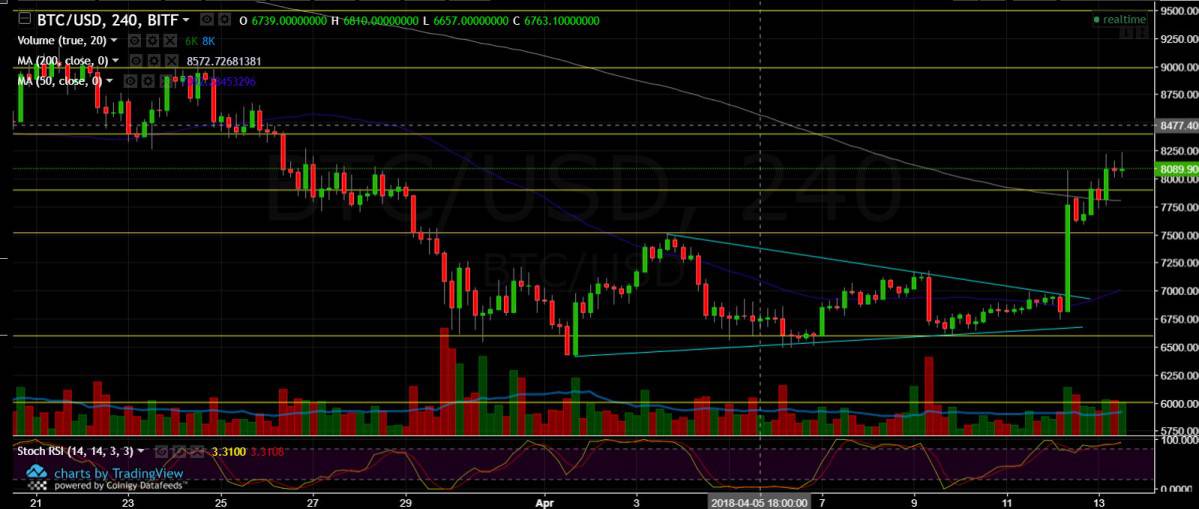
On our yesterday’s Bitcoin price analysis we mentioned the triangle that breaking it would lead a strong move. We didn’t know what direction, but we could expect a strong move.
As you all might have noticed, the direction was up – the move was extreme! It was the highest ever reached trading volume for one hour in Bitcoin’s short history. The amazing green candle had created a massive short squeeze, this happens when many people have short positions on heavy leverage, so a small movement up can trigger someone’s stop loss. Hence, when a short gets closed it creates a new buy order, that could lead to an effect we’ve witnessed yesterday.
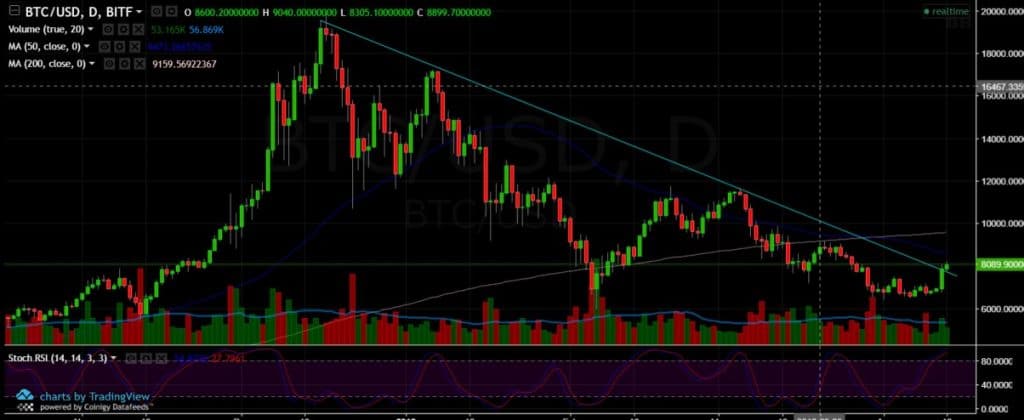
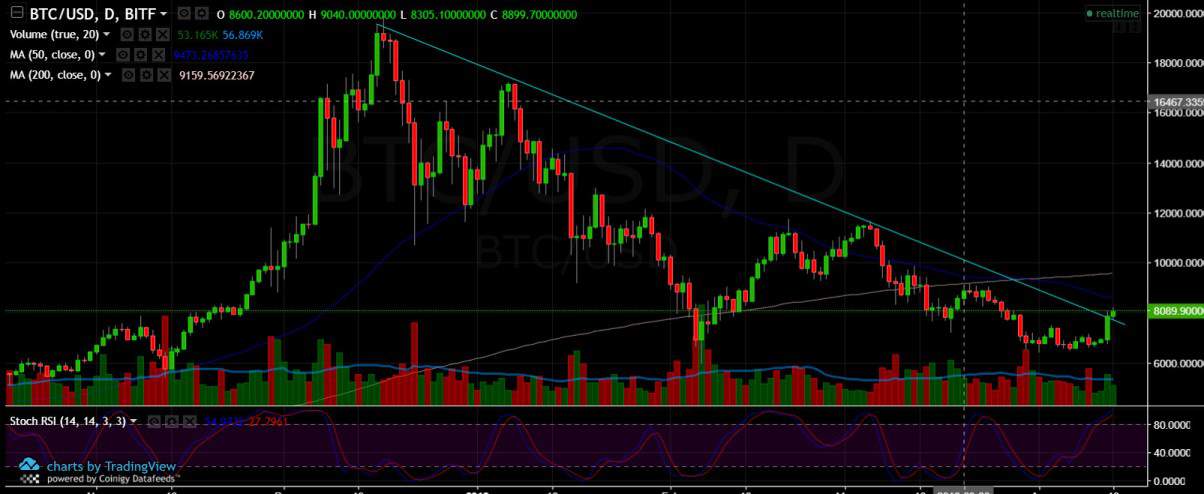
Finally, the consolidation area between $6,660 to $7,500 had broke up. This is a very bullish sign for the short-term and for the longer as can be seen on the Bitcoin 1 Day chart below. What can also be seen is that we broke up the long-term descending trend line on the 1 Day chart.
As of now, next target levels is the $8,400 resistance and afterwards the $9,000 strong resistance level. RSI is very high so we can expect a correction back to the $7,500-$7,800 area, where also MA-200 lies (resistance turned support).
BTC/USD BitFinex 4 Hours chart

BTC/USD BitFinex 1 Day overview chart
The post Bitcoin Price Analysis April.13 & Overview appeared first on CryptoPotato.
Publication date
Disclaimer
The views and opinions expressed in this article are solely those of the authors and do not reflect the views of Bitcoin Insider. Every investment and trading move involves risk - this is especially true for cryptocurrencies given their volatility. We strongly advise our readers to conduct their own research when making a decision.