Latest news about Bitcoin and all cryptocurrencies. Your daily crypto news habit.
Bitcoin saw some wild price action today as the cryptocurrency spiked almost 2% to the daily high of $59,815 but immediately dropped 5% in a matter of minutes, from there to reach the daily low of $56,710. It has since recovered, but the bottom line is that the $60K mark got rejected for the third time over the past two weeks.
A quick recap: Bitcoin had rebounded from the $43-44k zone at the beginning of March, and reached its current ATH of $61,781 toward the middle of the month.
 BTC charted another Bart pattern. Source: CryptoPotato’s twitter
From there, Bitcoin went on a short-term downtrend for 12 days until finding support at $50,265 (.618 Fib Retracement) on Thursday. It rebounded from this support last week and has since pushed higher to retest the crucial resistance of $60k just a few hours ago.
As of writing these lines, and after $600 million worth of positions got liquidated, BTC found support at $56,700 which is the 20-day moving average line. It held at this support and has since rebounded from there. This is best seen on the short-term charts.
A break of $60,000 will leave Bitcoin free to target the mid-March all-time high level. However, the third rejection today emphasized how much sellers’ supply is waiting there.
Overall, on the following daily timeframe Bitcoin is maintaining the higher-lows trajectory, which is long-term bullish.
BTC Price Support and Resistance Levels to Watch
Key Support Levels: $57,545, $56,700, $56,165, $55,000, $54,675.
Key Resistance Levels: $58,355, $59,000, $60,000, $60,760, $61,780.
Looking ahead, the first level of resistance lies at $58,355 (Feb 2021 highs). This is followed by $59,000, $60,000 (major resistance), and $60,760 (short term 1.414 Fib Extension). Above this, additional resistance lies at $61,780 (ATH price), $62,400 (1.272 Fib Extension), and $63,000.
On the other side, the first level of support lies at $57,545 (short term .236 Fib). This is followed by $56,700 (today’s low and MA-20), $56,165 (short term .382 Fib), $55,000, and $54,675 (.382 Fib).
The daily RSI is in the bullish territory, also facing critical support around the 60 mark.
Bitstamp BTC/USD Daily Chart
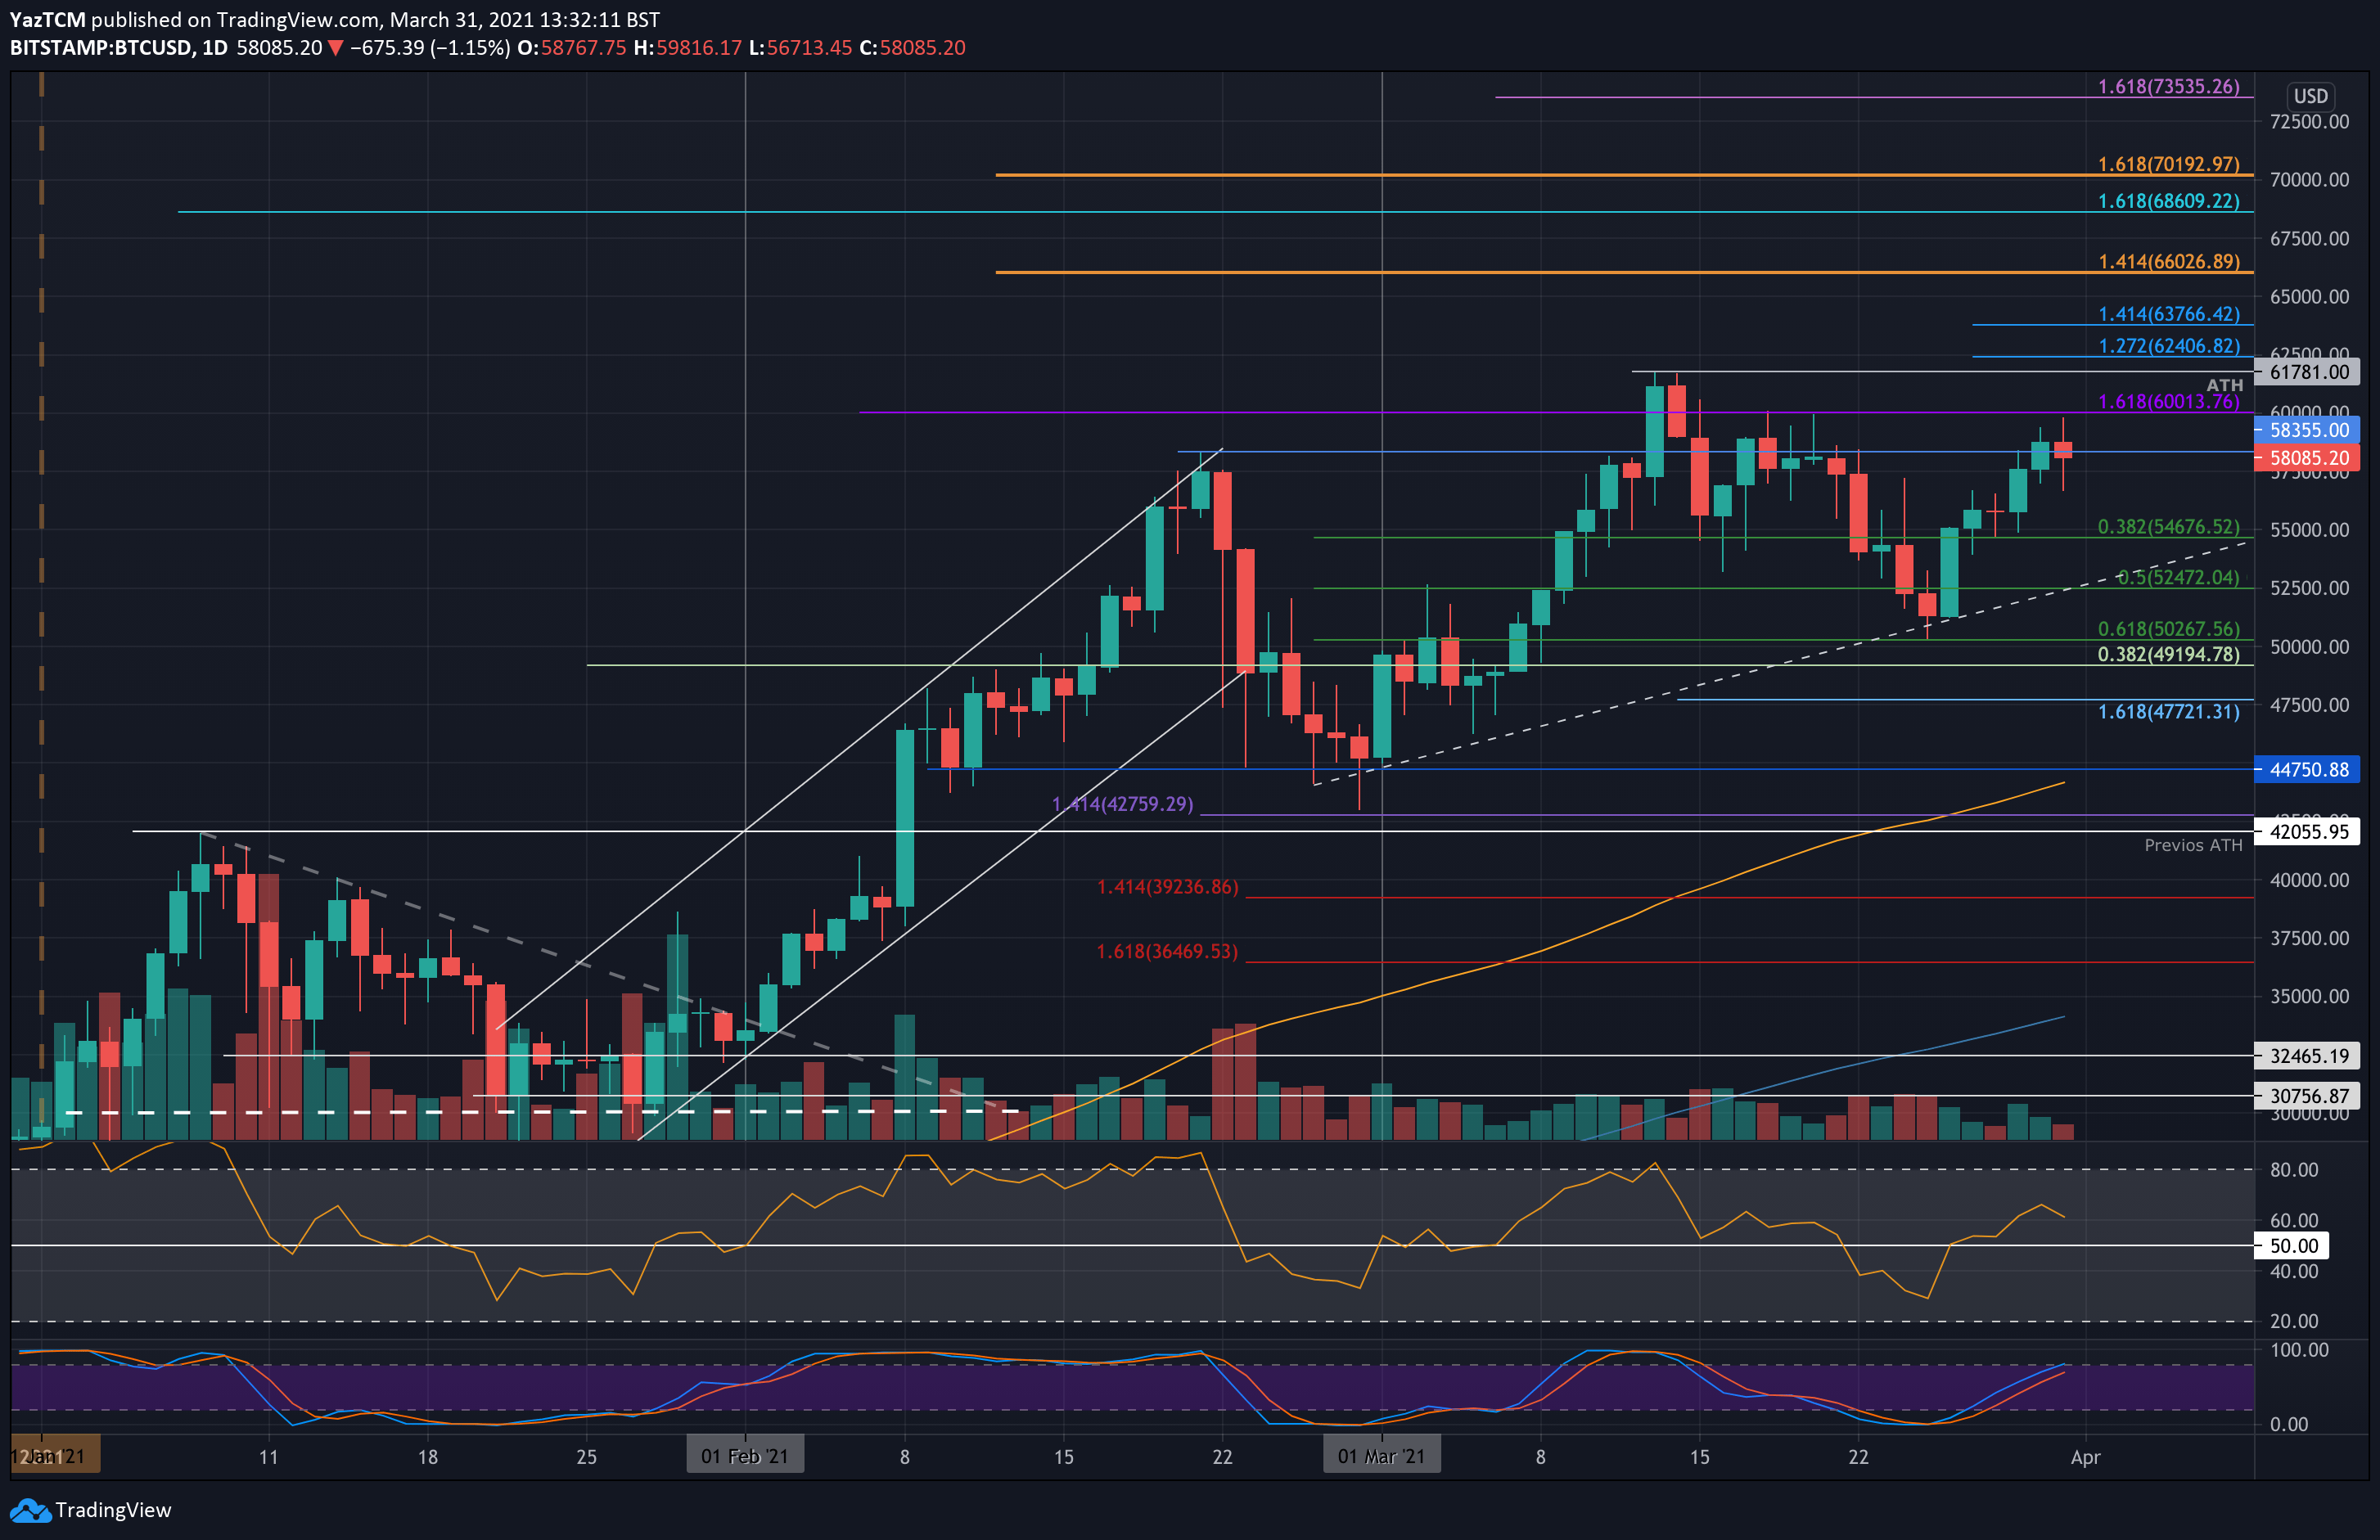 BTC/USD Daily Chart. Source: https://www.tradingview.com/x/DLal8OP9/
Bitstamp BTC/USD 4-Hour Chart
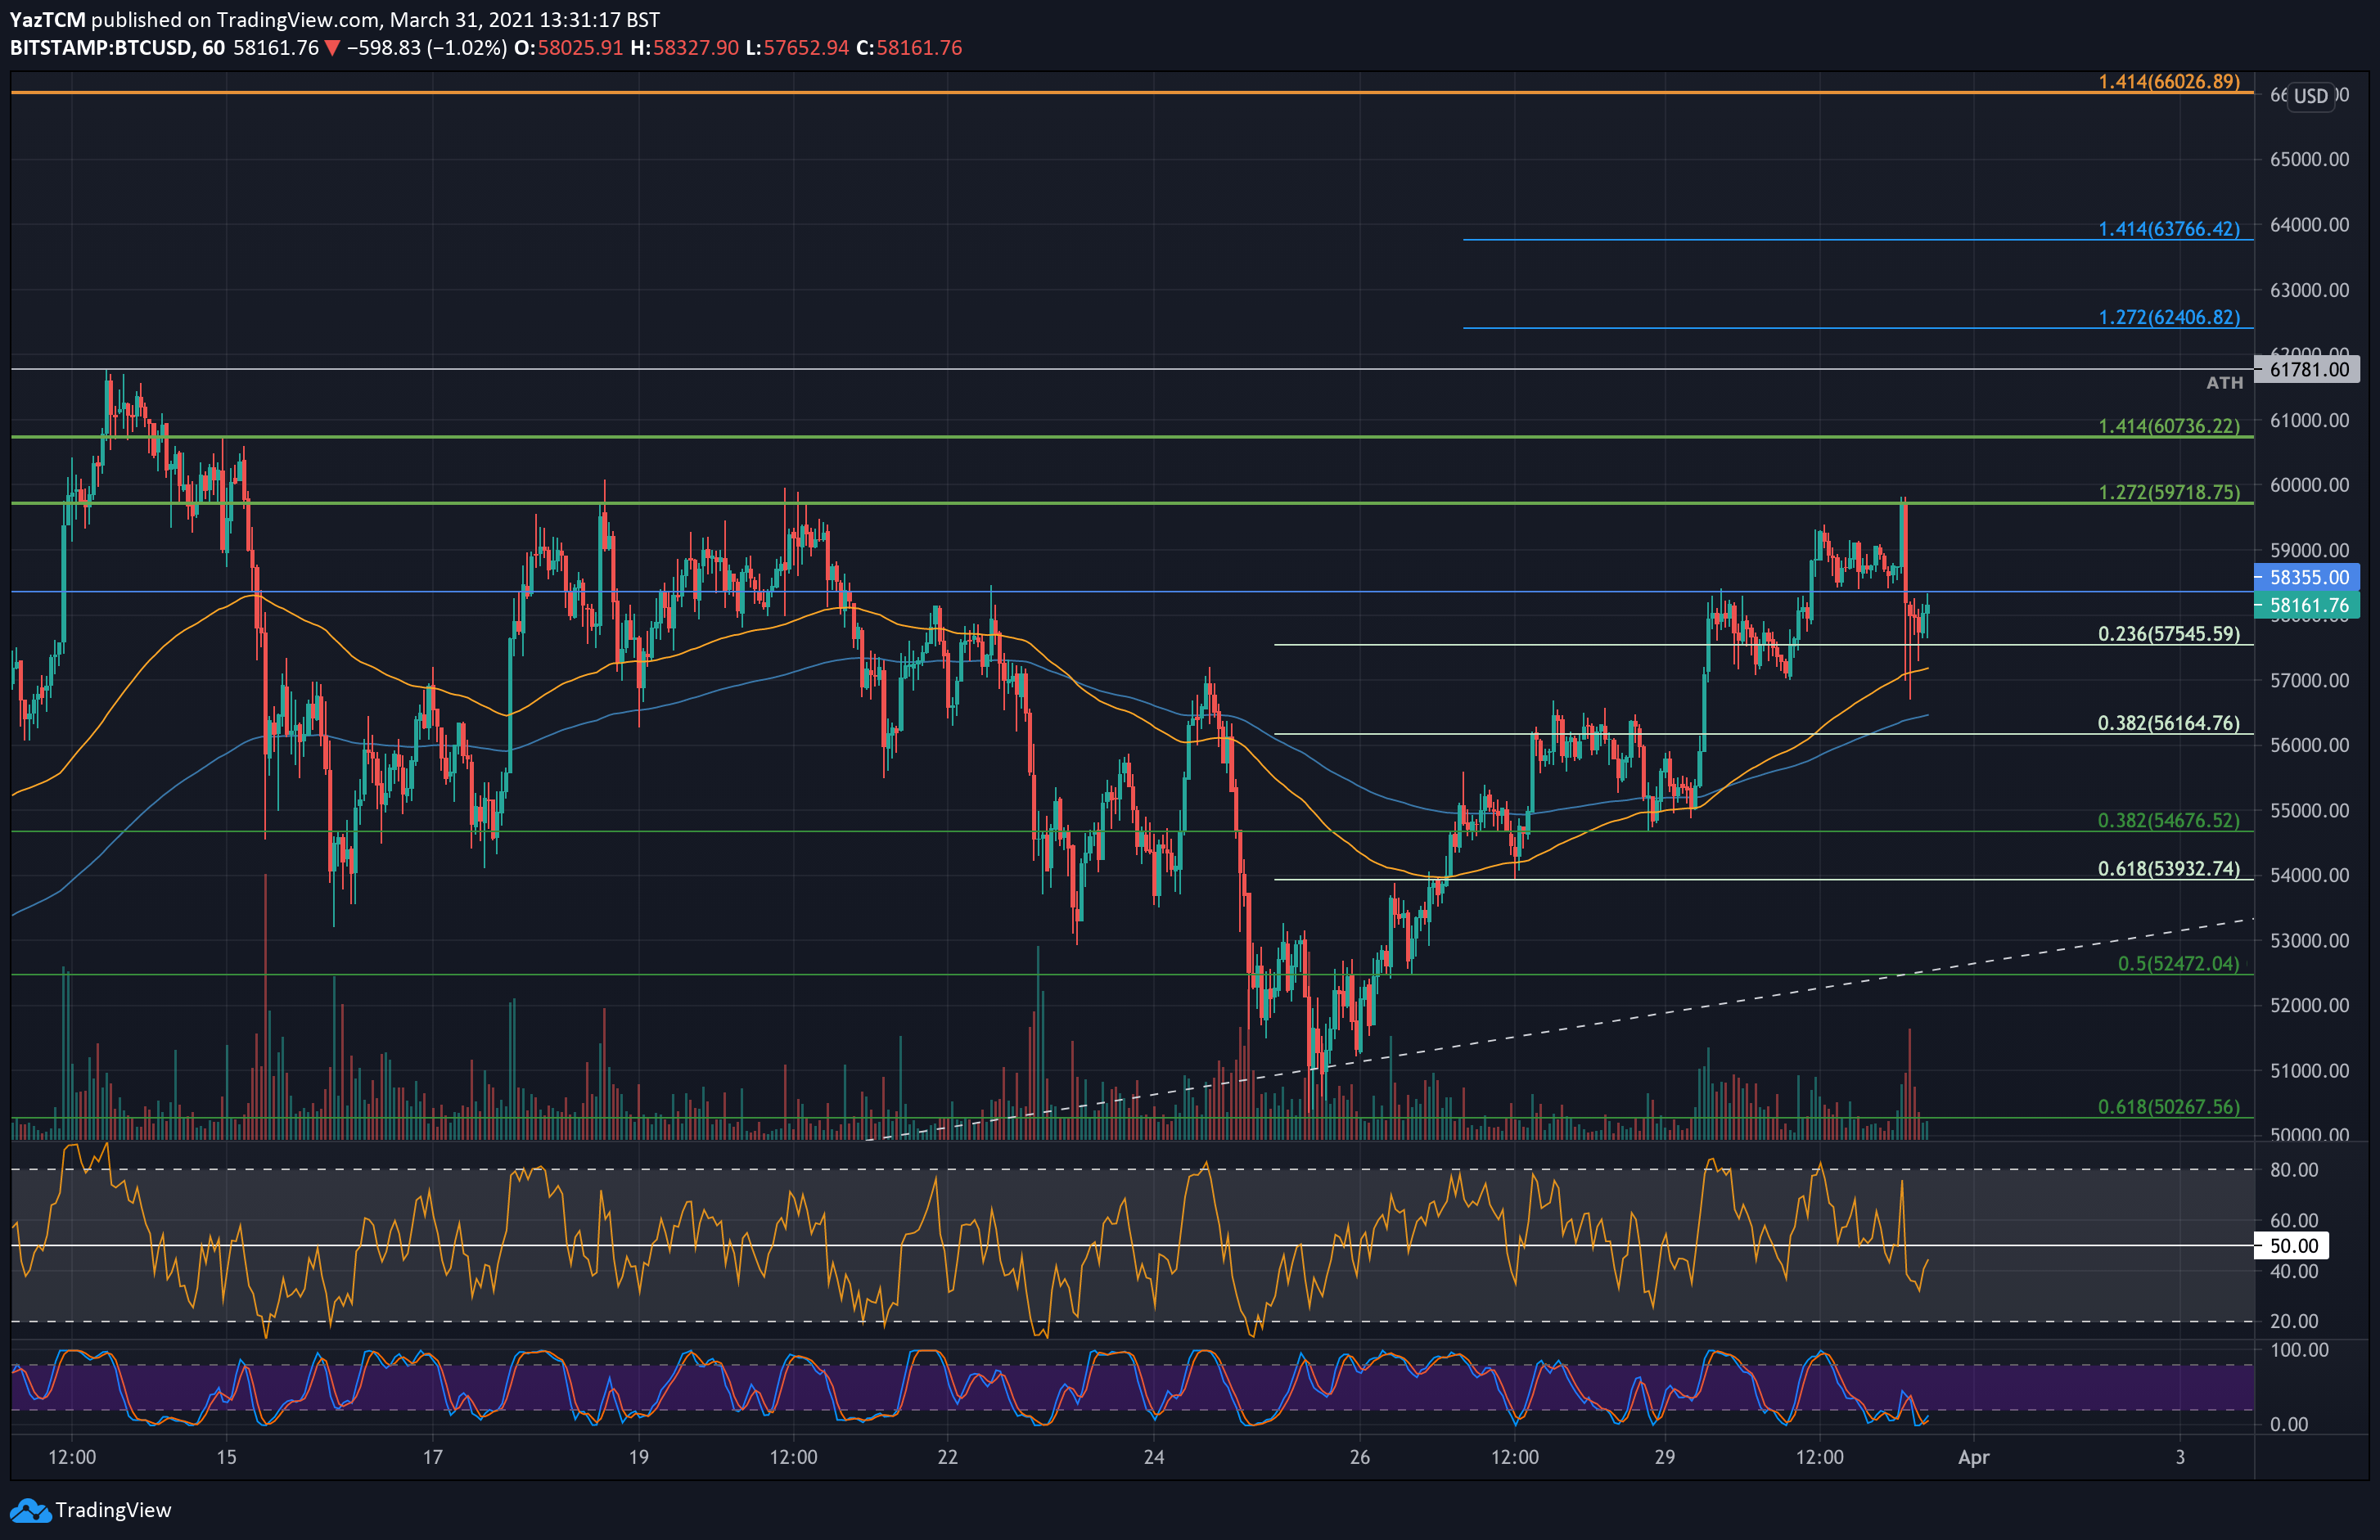 BTC/USD 1-Hour Chart. Source: https://www.tradingview.com/x/EsY6mGb0/
Publication date
Disclaimer
The views and opinions expressed in this article are solely those of the authors and do not reflect the views of Bitcoin Insider. Every investment and trading move involves risk - this is especially true for cryptocurrencies given their volatility. We strongly advise our readers to conduct their own research when making a decision.