Latest news about Bitcoin and all cryptocurrencies. Your daily crypto news habit.
Bitcoin price extended its decline below the $30,000 support against the US Dollar. BTC is finding bids near $29,250 and it might attempt an upside correction.
- Bitcoin is following a bearish path and it broke the key $30,000 support zone.
- The price is now trading well below $31,000 and the 100 hourly simple moving average.
- There is a key bearish trend line forming with resistance near $31,300 on the hourly chart of the BTC/USD pair (data feed from Kraken).
- The pair could start a decent upside correction if it remains stable above the $29,250 level.
Bitcoin Price Settles Below $30K
Bitcoin price extended its decline below the $30,200 and $30,000 support levels. BTC even settled well below the $30,000 level and the 100 hourly simple moving average to move further into a bearish zone.
The price even spiked below $29,500 and traded as low as $29,313. It seems like bitcoin is forming a support base above the $29,250 level. An initial resistance on the upside is near the $30,000 level. It is close to the 23.6% Fib retracement level of the recent downward move from the $31,900 swing high to $29,313 low.
The first major resistance is near the $30,600 level. It is near the 50% Fib retracement level of the recent downward move from the $31,900 swing high to $29,313 low.
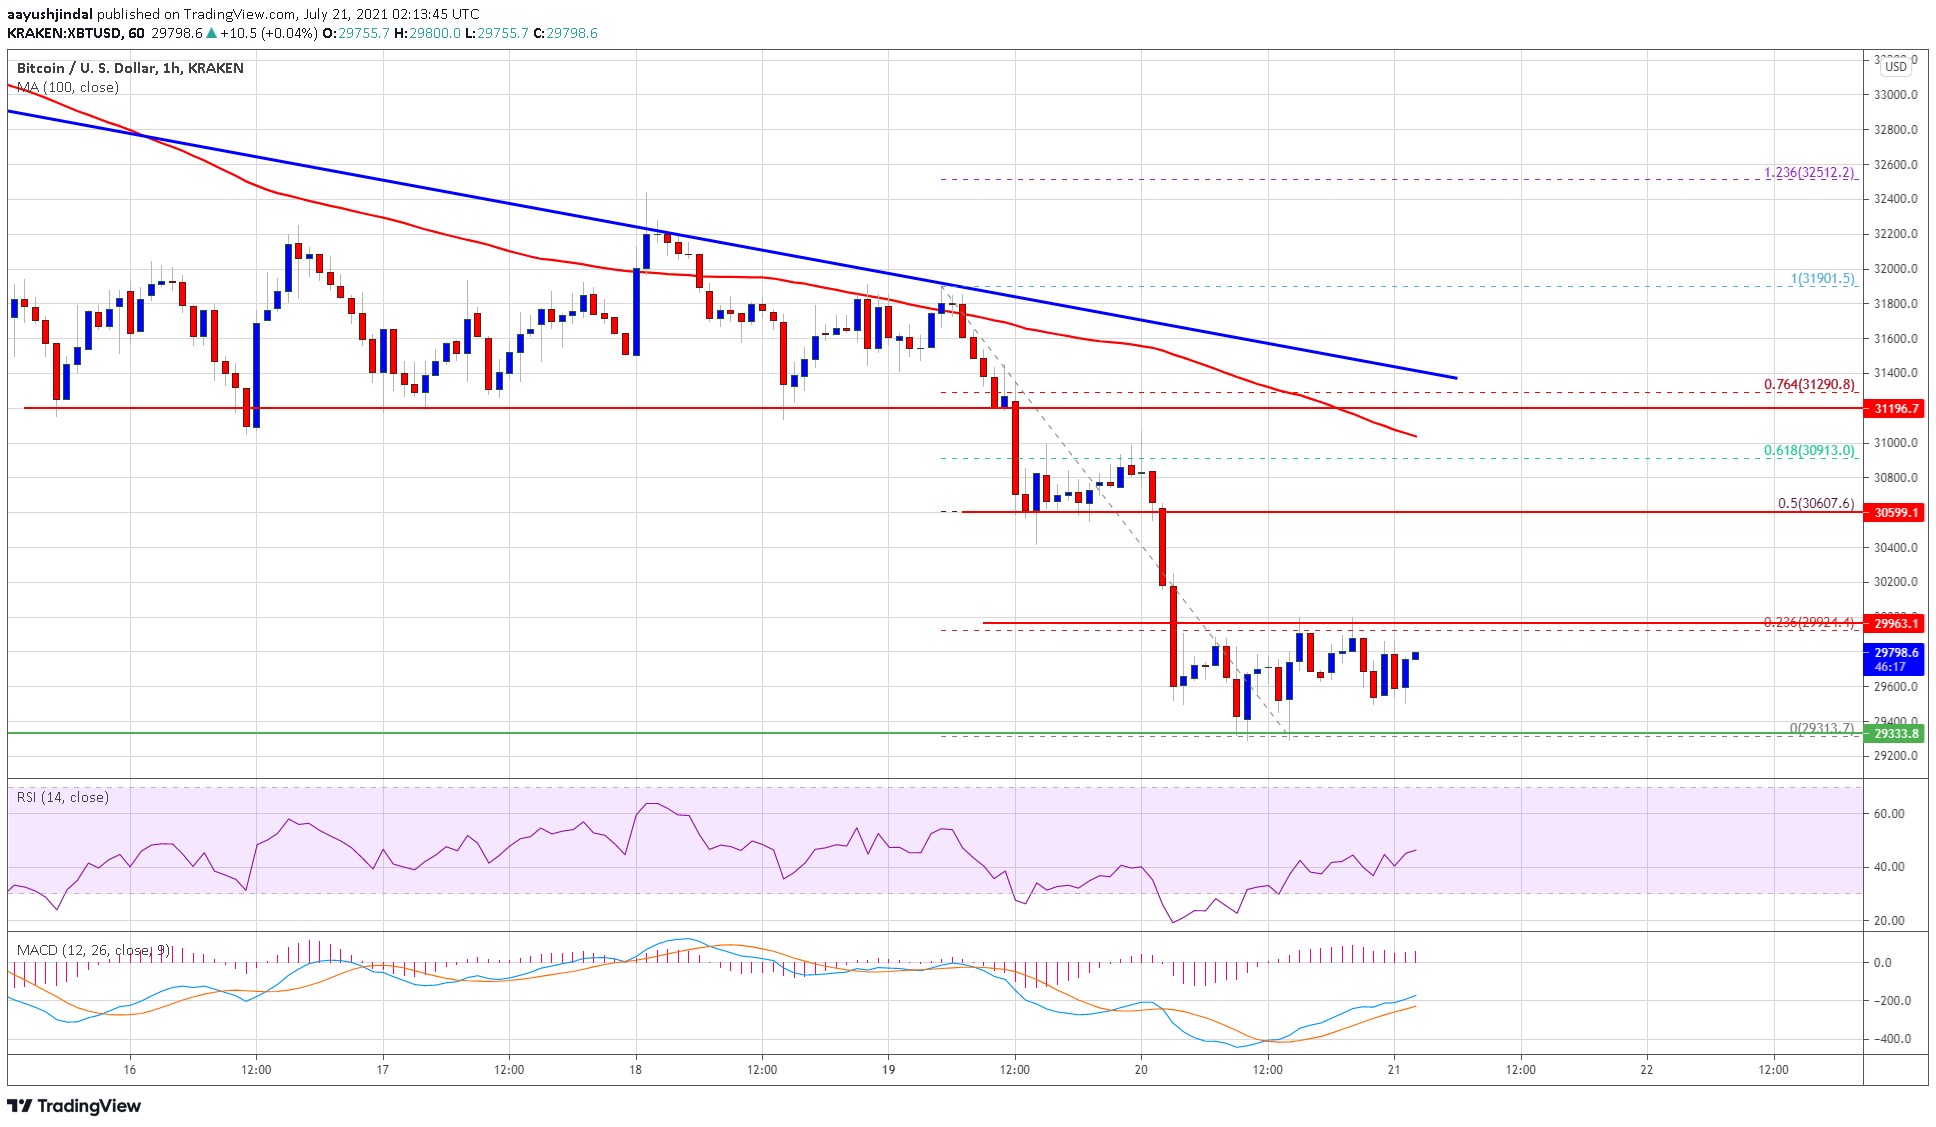
Source: BTCUSD on TradingView.com
There is also a key bearish trend line forming with resistance near $31,300 on the hourly chart of the BTC/USD pair. In the short-term, bitcoin price might start a decent recovery above $30,000, but it might face barriers near the $31,000 level in the near term.
More Losses in BTC?
If bitcoin fails to recover above the $30,000 and $30,600 resistance levels, there is a risk of more losses. An initial support on the downside is near the $29,350 level.
The first major support is now near the $29,250 zone. A clear downside break below the recent low and $29,250 might call for a move below the $29,000 level. The next key support is seen near the $28,000 level.
Technical indicators:
Hourly MACD – The MACD is now losing pace in the bearish zone.
Hourly RSI (Relative Strength Index) – The RSI for BTC/USD is rising and it might soon clear the 50 level.
Major Support Levels – $29,250, followed by $29,000.
Major Resistance Levels – $30,000, $30,600 and $31,000.
Publication date
Disclaimer
The views and opinions expressed in this article are solely those of the authors and do not reflect the views of Bitcoin Insider. Every investment and trading move involves risk - this is especially true for cryptocurrencies given their volatility. We strongly advise our readers to conduct their own research when making a decision.