Latest news about Bitcoin and all cryptocurrencies. Your daily crypto news habit.

- Since the rejection from $50,648, buyers kept Bitcoin price above the 100-day SMA near $46,000.
- On-chain data by Glassnode reveals increased on-chain demand accumulation as investors eye another liftoff above $50,000.
Bitcoin has remained lethargic in its trading since last week. The rejection from $50,548 left investors dejected because their expectation was for BTC to climb past $55,000 and close August near $60,000.
However, the bellwether cryptocurrencyBitcoin (BTC) Price Stalls At Major Resistance, Is a Minor Correction On Cards? trimmed gains heading toward $46,000. The 100-day Simple Moving Average (SMA) support, holding slightly above $46,000, has been instrumental, ensuring that losses did not stretch further.
Bitcoin Price Gradually Builds Momentum For Ultimate Takeoff
Meanwhile, Bitcoin is teetering marginally above $46,000. The homestretch to $50,000 seems near yet challenging to achieve, especially with multiple short-term sell signals.
The moving Average Convergence Divergence (NACD) indicator calls on investors to offload their bags. This sell signal was reinforced on August 26 as Bitcoin retreated from areas above $50,000. As the technical tool closes in on the mean line, Bitcoin will likely trigger another selloff below the 100-day SMA.
Hence, bulls must keep the 100-day SMA intact to ensure that losses are not extended. Trading below $46,000 may leave BTC more vulnerable as the existing FOMO in the market shifts into panic selling.
On the upside, a daily close above $48,000 will cement the bulls’ presence in the market. As Bitcoin gains traction to $50,000, FOMO is bound to push the price higher and perhaps confirm a colossal swing toward $60,000.
BTC/USD Daily Chart
 BTC/USD price chart by Tradingview
According to Glassnode, a leading on-chain data analytics platform, Bitcoin holds above a top end of a solid on-chain support zone. Nearly 1.65 million BTC currently have an on-chain cost basis ranging between $45,000 and $50,000.
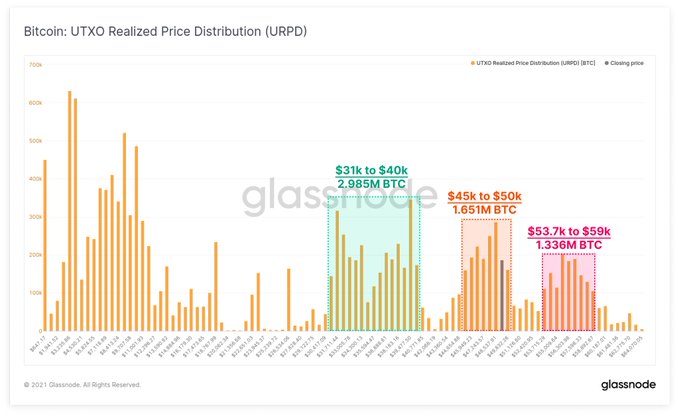 bitcoin On-chain Accumulation Chart by Glassnode
In the chart above, the green zone ranging between $31,000 and $40,000 “is also home to another 2.98 million BTC indicative of large accumulation demand.” If these on-chain support areas remain intact, we expect Bitcoin to resume the uptrend above $50,000. The run to $60,000 will depend on BTC’s attractiveness to investors and the risk appetite level.
Bitcoin Intraday Levels
Spot rate: $47,124
Trend: Slightly Bullish
Volatility: Low
Support: 46,000
Resistance: $48,000
The post Bitcoin Price Analysis: BTC Bulls Show Utmost Resilience Above $46,000 While Eyeing Liftoff To $50,000 appeared first on Coingape.
Publication date
Disclaimer
The views and opinions expressed in this article are solely those of the authors and do not reflect the views of Bitcoin Insider. Every investment and trading move involves risk - this is especially true for cryptocurrencies given their volatility. We strongly advise our readers to conduct their own research when making a decision.