Latest news about Bitcoin and all cryptocurrencies. Your daily crypto news habit.
The UNIUSDT crypto pair started to make sharp up and down swings, following a monthly price close above the June bearish inside bar resistance [29.3803]. This created a massive opportunity for swing traders to track specific trend reversal and continuation chart patterns like the divergence.
Let’s dive into it.
 uni price analysis
The bearish trend was confirmed with a hidden bearish divergence formation on September 06 04:00, after an earlier price close below the September 01 00:00 support.
Efforts by the bulls to restore dominance collapsed to a third bearish divergence on September 15 20:00, which sent the UNI token into a 31.5% downward spiral.
A massive surge in demand after a bear squeeze on September 26 at 08:00 set’s a bullish undertone for the UNI token as the bulls attempt a price close above the bearish inside bar resistance [23.28].
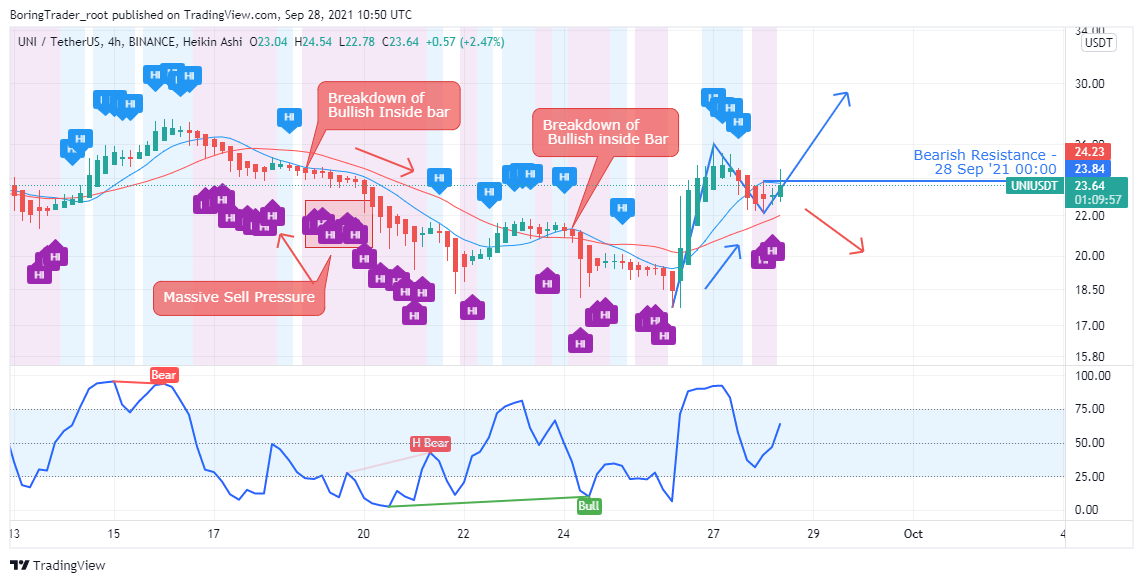
Switching to the Heiken Ashi charts revealed the massive sell pressure and breakdown of inside bar support that fueled the downtrend.
We should expect the uptrend to resume if the RSI closes above the level-75 for a second time. A further breach of the 17.73 low would confirm a choppy and bearish outlook for the UNIUSDT crypto pair.
UNISWAP (UNI) Intraday Levels
- Spot rate: $23.95
- Mid–Term Trend [H4]: Bearish bias
- Volatility: High
The post UNI Token Price Analysis: Sharp Volatile Swings on the 4HR Time Frame, Here’s key Levels to Watch appeared first on Coingape.
Publication date
Disclaimer
The views and opinions expressed in this article are solely those of the authors and do not reflect the views of Bitcoin Insider. Every investment and trading move involves risk - this is especially true for cryptocurrencies given their volatility. We strongly advise our readers to conduct their own research when making a decision.