Latest news about Bitcoin and all cryptocurrencies. Your daily crypto news habit.

Lark Davis, famous New Zealand-based crypto analyst stated reasons for his bullish position on the DOT token of the Polkadot ecosystem on 10 October. A notable reason being the announcement of Polkadot Parachains by Dr. Gavin Wood.
Polkadot (DOT), now viewed by many analysts as layer-0, allows developers to build smart contract blockchains like ETH as a Parachain, which is only available as a slot, auctioned via crowd loan that requires DOT for participation.
Also in the news is Wanchain’s integration of Polkadot into its cross-chain infrastructure.
Wanchain, a decentralized blockchain interoperability solution is set to integrate its non-custodial cross-chain infrastructure with Polkadot’s multi-chain blockchain.
The Wanchain/Polkadot integration makes for a seamless connection of Polkadot to a wide range of Networks, starting with Ethereum, Wanchain, Moonriver, and Avalanche. It will further connect Polkadot to a broader range of cross-chain on DeFi ecosystems, making it easy for DOT to be used with smart contracts that are compatible with the EVM and traded on multiple chains.
Polkadot (DOT) Weekly Chart Analysis

The above weekly chart of the DOTUSDT shows the DOT price enclosed in a symmetrical triangle, formed by opposing bearish and bullish divergence patterns after the RSI exits the overbought area.
A breakout of the bearish divergence trend line should trigger buy-stop orders above the $38.77 resistance.
Also, traders can also DCA-dollar cost average into the uptrend if the price makes a sharp slump to the $10.37 bullish divergence support, entering long at a price discount.
Polkadot (DOT) Daily Chart Analysis
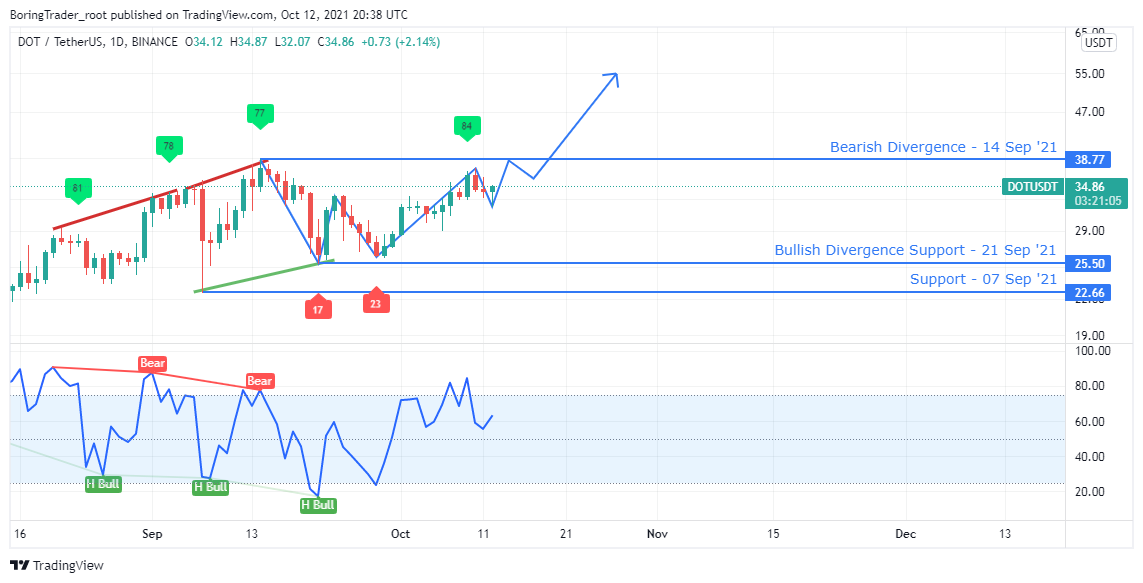
A view from the daily time frame reveals the DOTUSDT in an ascending channel, also formed by opposing bearish and bullish divergence price vs. RSI oscillator pattern.
The RSI suggests an uptrend mode upon crossing above level-75 and trading above level-25. A breach of the $38.77 price resistance would confirm our anticipated bullish take over towards the $55.00 round-number resistance.
Short selling at the current price point is considered risky as bears could get short squeezed.
Polkadot (DOT) 4 Hr Chart Analysis
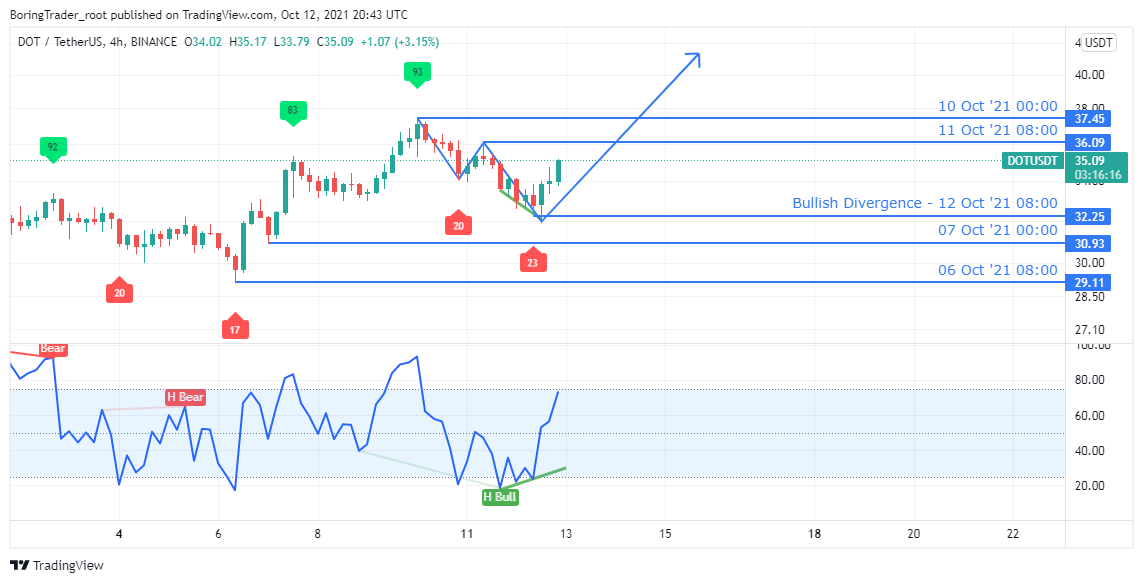
A hidden bullish divergence signaled at the time of this report suggests the intraday price floor as the DOT price scurries towards the $37.45 resistance.
It’s obvious that the bulls are in control and traders could eye the $40.00 mark as the first profit target and the $50.00 level as the second profit target.
- Bullish and Bearish Scenario
The top-down approach to analyzing the DOTUSDT helps us avoid time frame biases that could be detrimental to our overall trading/investment objective. With that said, the DOTUSDT is mostly in an uptrend on the analyzed timeframes and gets set to establish a new ATH.
However, although it is quite unlikely, a breakdown of the $32.25 support will return control to the bears.
The post Polkadot (DOT) Price Analysis: Imminent Breakout of Symmetrical Triangle, Time to Buy the Dip? appeared first on Coingape.
Publication date
Disclaimer
The views and opinions expressed in this article are solely those of the authors and do not reflect the views of Bitcoin Insider. Every investment and trading move involves risk - this is especially true for cryptocurrencies given their volatility. We strongly advise our readers to conduct their own research when making a decision.