Latest news about Bitcoin and all cryptocurrencies. Your daily crypto news habit.

Cardano (ADA) price recently slipped off its third position to the fourth crypto by market cap, allowing the Binance BNB to take its spot as investors lose enthusiasm. Its current fourth position is also threatened by the USDT stablecoin with a market cap of a little above 69 billion US dollars.
A new decentralized lending protocol ADALend is launched on the Cardano ecosystem, to therefore facilitate immediate access to loans and collaterals, by offering permissionless lending on any crypto pair, incentivized liquidity, community governance, and ecosystem foundation layer.
Cardano’s expansion of its use cases into Artificial Intelligence, a 6 million US dollar fund in Africa, and other interesting milestones on its project road map should keep the Proof of Stake crypto-asset in the top 10 ranking for a long time.
Q3 data from E-Toro, the social trading platform reveals that ADA and XRP are the mo
Pairing an ALT-Coin against Bitcoin BTC is one good way of measuring investor demand and confidence for the project.
Cardano Price Analysis: (ADABTC) Weekly Chart
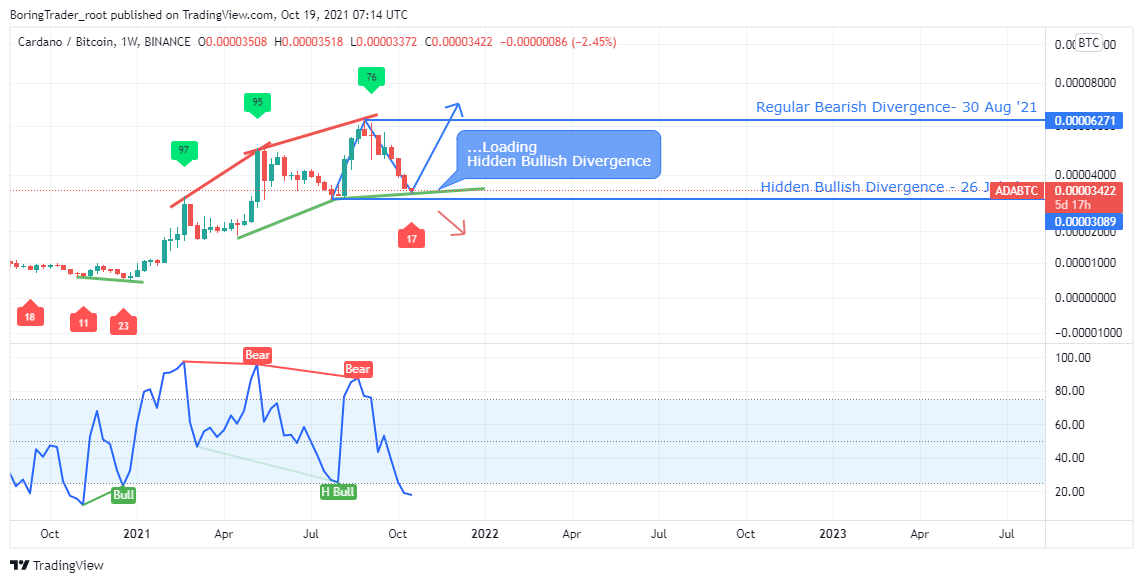
The ADABTC chart from the weekly time frame shows an increase in demand for Bitcoin BTC over the ADA altcoin, with the price chart triggering a bearish divergence on 30 August ’21.
A counter hidden bullish divergence is anticipated as the ADABTC price trades above and near the 26 July ’21 hidden bullish divergence support line.
There’s a probable chance of bullish interest towards the ADA token by the end of Q4 ’21.
Read on for further analysis of the ADAUSDT price chart, as we continue from the weekly time frame and rounding it up on the 4HR time frame.
Cardano Price Analysis: (ADAUSDT) Weekly Chart

The ADA price triggers a bear-trap candlestick pattern on 20 September and started to form low volume candlesticks contrary to the expected price hike to the upside.
Although we may see low volatility at press time, we still maintain a positive bias toward the ADA coin since the RSI values have not dipped below level-25.
Cardano Price Analysis: (ADAUSDT) Daily Chart

Zooming down to the daily time frame reveals a clearer view of the ADAUSDT in a range-bound market structure with declining volatility.
A price explosion is usually expected after a breakout or breakdown of the $2.459 and $1.910 resistance and support levels, as we lean toward the upside direction.
Cardano Price Analysis: (ADAUSDT) 4HR Chart
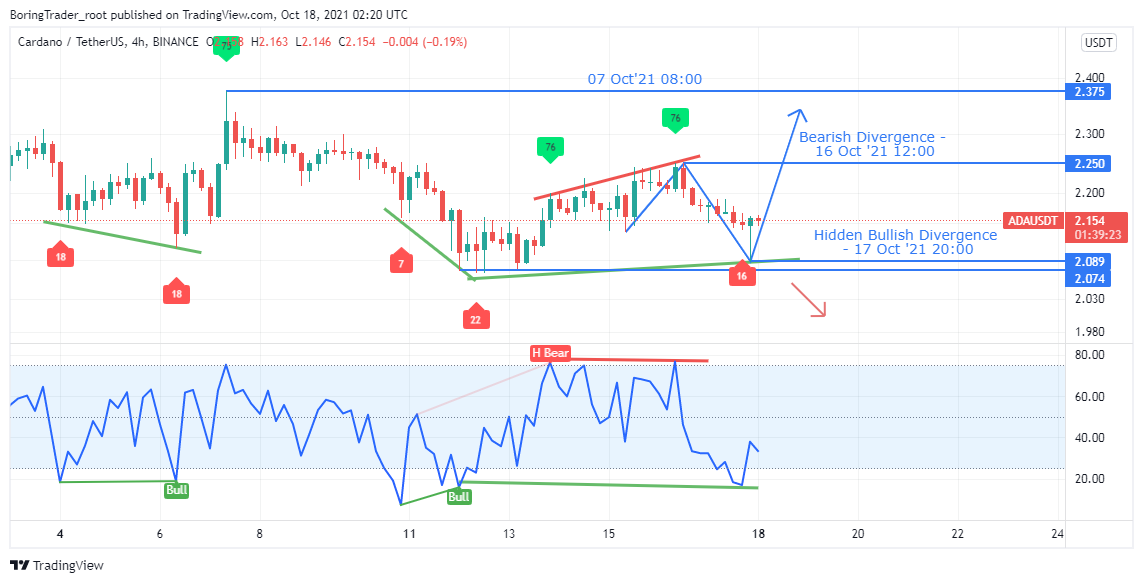
A final look into the ADAUSDT from the intraday time frame reveals a series of bullish divergence signals alongside a Pin-bar candlestick pattern at press time.
The ADA price is projected to shoot for the $2.375 mark after it breaks above the $2.250 bearish divergence resistance.
Cardano (ADAUSDT) Intraday Levels
- Spot rate: 1.1782
- Mid–Term Trend [H4]: Bullish
- Volatility: High
- Support: $1.0589, $1.0171, and $0.8861
- Resistance: $1.2089, $1.400
The post ADA Price Prediction: Weekly Chart [ADABTC] Reveals Hidden Bullish Divergence in Making, Can ADA Outperform BTC in Q4? appeared first on Coingape.
Publication date
Disclaimer
The views and opinions expressed in this article are solely those of the authors and do not reflect the views of Bitcoin Insider. Every investment and trading move involves risk - this is especially true for cryptocurrencies given their volatility. We strongly advise our readers to conduct their own research when making a decision.