Latest news about Bitcoin and all cryptocurrencies. Your daily crypto news habit.
Despite the listing on Robinhood, SHIB has lost most of its recent gains.
Key Support level: $0.000023
Key Resistance level: $0.000028
The rally last week, which was following the news, could not hold SHIB’s price above the key resistance at $0.000028.
Since then, SHIB has dropped back toward the critical support at $0.000023, where it found a local bottom. However, the overall price action is turning bearish despite some attempts from buyers to change this.
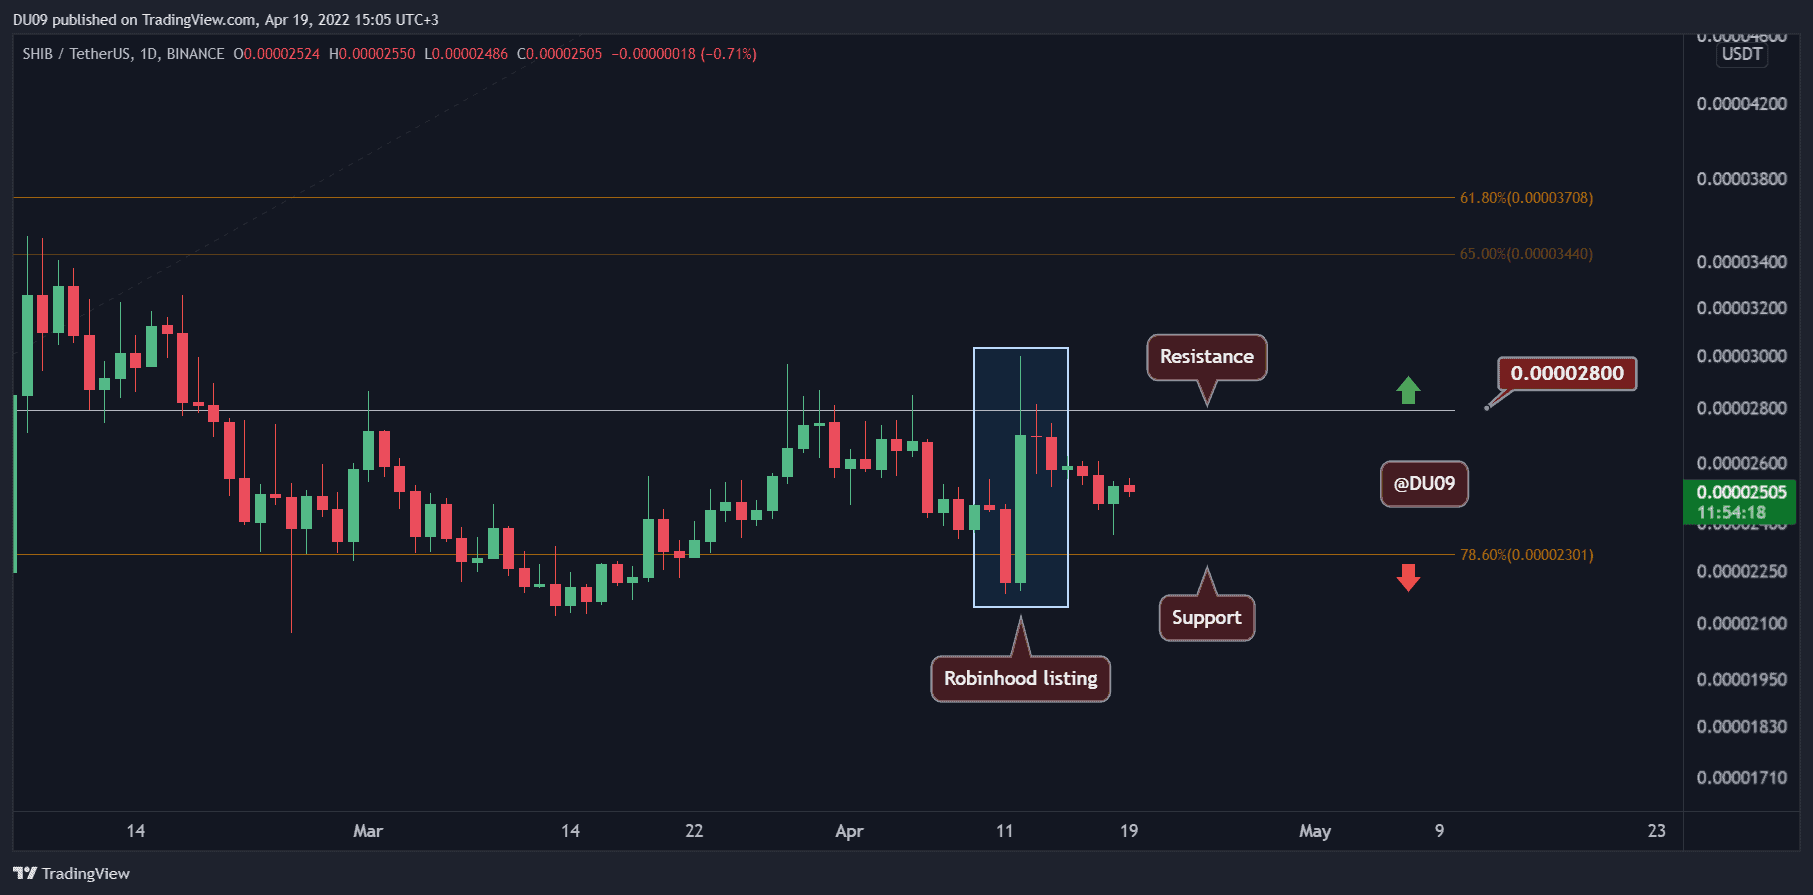
Chart by TradingView
Technical Indicators
Trading Volume: The volume of the past days was low, without sufficient momentum to push SHIB away from its current range.
RSI: The daily RSI remains around the 50 points level, but this can quickly change if SHIB breaks below the critical support.
MACD: The daily MACD did a bullish cross during the news about Robinhood, but now it crossed back and turned bearish again.

Chart by TradingView
Bias
The bias on SHIB is bearish.
Short-Term Prediction for SHIB Price
SHIB appears to be unable to leave the price range that it was trading at, back in March. Now, the price is quickly approaching the key support at $0.000023.
Publication date
Disclaimer
The views and opinions expressed in this article are solely those of the authors and do not reflect the views of Bitcoin Insider. Every investment and trading move involves risk - this is especially true for cryptocurrencies given their volatility. We strongly advise our readers to conduct their own research when making a decision.