Latest news about Bitcoin and all cryptocurrencies. Your daily crypto news habit.
Introduction
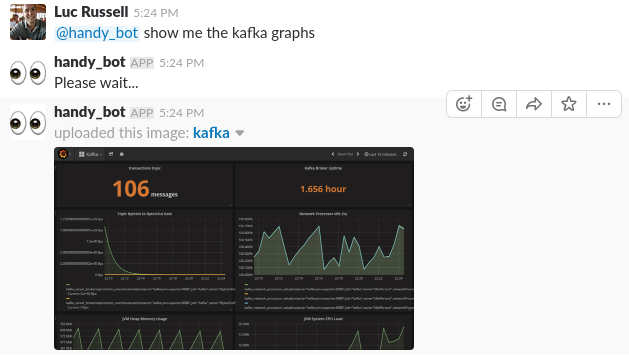
This tutorial describes an approach for building a simple ChatOps bot, which uses Slack and Grafana to query system status. The idea is to be able to check the status of your system with a conversational interface if you’re away from your desk, but you still have basic connectivity e.g. on your phone:
This tutorial is split into two parts; the first part will set up the infrastructure for monitoring Kafka with Prometheus and Grafana, and the second part will build a simple bot with Python which can respond to questions and return Grafana graphs over Slack.
Notifications are a native feature of Grafana, i.e. the ability to send alert messages to a Slack channel if conditions are breached. A Slack bot is a slightly different tool; it will be able to respond to simple questions about the state of a system to assist with troubleshooting.
The goal is to design something which runs inside a firewalled environment, without requiring proxy access, or access to any 3rd party services like Amazon S3. Graph images are therefore generated on the local file system and uploaded as attachments to Slack, to avoid hosting on public infrastructure.
 Components
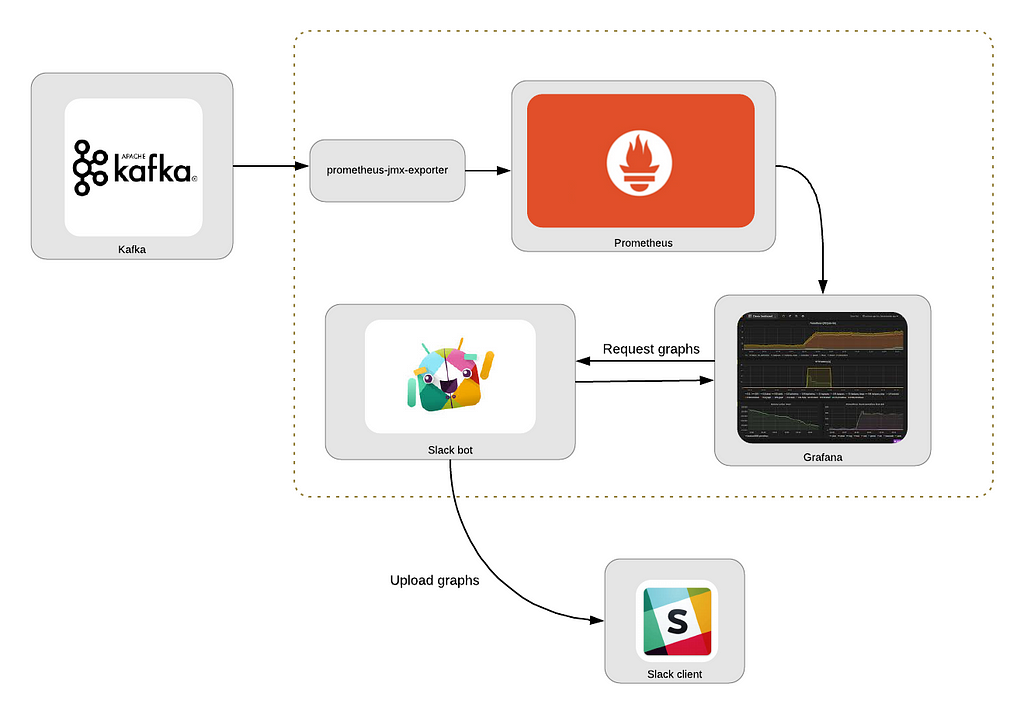
The main components here are:
Kafka: A message streaming platform. This is the system we’re interested in monitoring.
Prometheus: A monitoring system for collecting metrics at given intervals, evaluating rules, and triggering alerts.
prometheus-jmx-exporter: A Prometheus collector that can scrape and expose JMX data, allowing us to collect metrics from Kafka.
Grafana: A visualization platform, commonly used for visualizing time series data for infrastructure and application analytics. This allows us to graphically display collected metrics.
Slack: The messaging application, which will allow us to interface with our chat bot.
Slack bot: Described in Part Two below, a simple Python script which can retrieve graphs from Grafana and upload to Slack.
These steps are based around monitoring Kafka, but the same general approach could be followed to integrate with other services.
Let’s Get Started
Full source code is available here.
Prerequisites
- Basic knowledge of Python: the code is written for Python 3.6.
- Docker: docker-compose is used to run the Kafka broker.
- kafkacat: This is a useful tool for interacting with Kafka (e.g. publishing messages to topics)
Note: if you‘re in a hurry to start everything up, just clone the project from the link above and run docker-compose up -d.
There are two parts to the remainder of this tutorial; the first part describes how to set up the monitoring infrastructure, and the second walks through the Python code for the Slack bot.
Part One: Assemble a Monitoring Stack
We’ll use Grafana and Prometheus to set up a monitoring stack. The service to be monitored is Kafka, which means we’ll need a bridge to export JMX data from Kafka to Prometheus. This prometheus-jmx-exporter docker image fulfills this role nicely. This service extracts metrics from Kafka’s JMX server and exposes them over HTTP, so they can be polled by Prometheus.
To enable JMX metrics in the Kafka server, we need to apply some configuration settings to the Kafka server, and link the kafka-jmx-exporter container with the Kafka server:
- Ensure the KAFKA_JMX_OPTSand JMX_PORT environment variables are set on the kafka container
- Ensure the kafka-jmx-exporter and kafka containers are on the same network (backend)
- Ensure the JMX_HOST value for the kafka-jmx-exporter container matches the KAFKA_ADVERTISED_HOST_NAME on the kafka container
- Ensure the KAFKA_ADVERTISED_HOST_NAME has a corresponding entry in /etc/hosts.
- Pin wurstmeister/kafka to version 1.0.0. There may be an issue configuring JMX with earlier versions of the wurstmeister/kafka image
- Pin prom/prometheus to version v2.0.0
- That upgrade requires one compatibility change, which is to rename target_groups to static_configs in the prometheus.yml file.
The resulting sections of the docker-compose.yml should look like this:
Grafana can be configured to read a JSON dashboard file at startup; there is one supplied in the etc/Kafka.json directory, pre-configured with some sample Kafka monitoring information.
Start the Monitoring Stack
With everything configured appropriately, you should be able to start the stack withdocker-compose up -d. Then send a few messages to Kafka:
for i in `seq 1 3`;do echo "hello" | kafkacat -b kafka:9092 -t transactionsdone
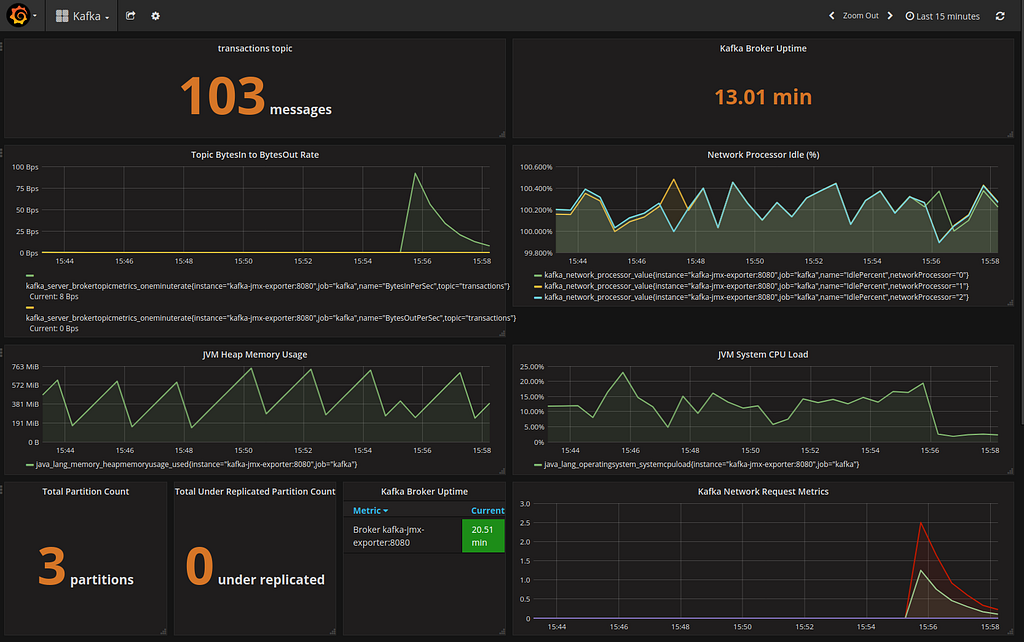
View the Kafka dashboard at http://localhost:3000, and you should see something like this:
Part Two: Build the Slack Bot
With the monitoring infrastructure in place, we can now write our simple Slack bot. This section describes the steps to create the bot, and some relevant snippets from the code.
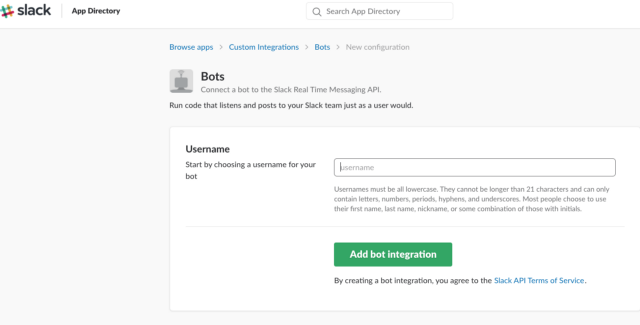
The first step is to create and register the bot on the Slack website, which you can do by logging in to Slack, going to the https://api.slack.com/bot-users page, then searching on that page for “new bot user integration”:
On the next screen you can customize details, e.g. add an icon and description for the bot.
When your bot is created, go ahead and invite it somewhere. You can create a private channel for testing:
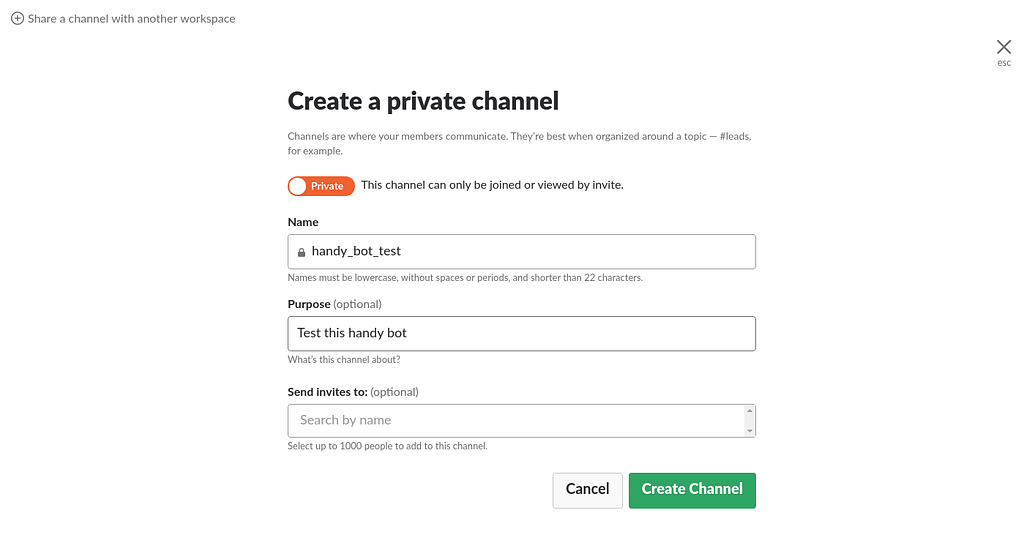 Create a channel for testing
Then invite the bot to the test channel with /invite @handy_bot:
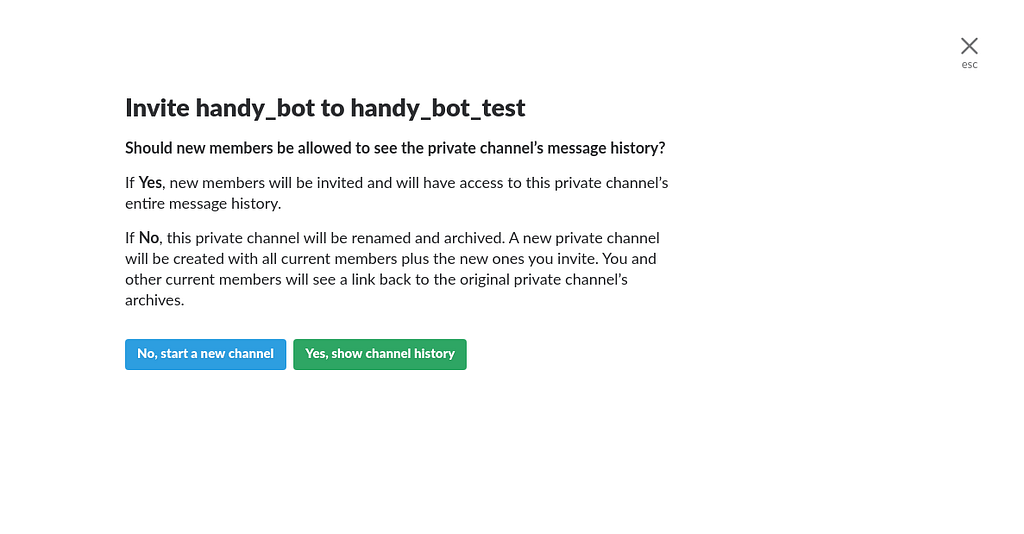 Invite the bot
Our bot will respond to a few simple questions which we’ll define on lines 1–3:
In app.py, we’ll read our configuration file and start the bot:
The start method looks like this:
line 2: makes a connection to the Slack API
line 5: on a given polling frequency (1 second), check if there are any new events
line 7: if the event is a message, drop into the on_message method, and if we get a response from that method, print it out to the channel that the message was posted in:
The on_message method is where we’ll decide how to respond to the messages the bot receives. The generate_and_upload_graph method is the most interesting response; the idea here is to start up a temporary Docker container to capture the screenshot.
Grafana does have a facility to render any graph as a PNG file. However, in the latest release of Grafana there appears to be an error with the phantomjs library used internally for image generation.
A more reliable utility for headless browsing is Puppeteer, based on Google Chrome, and someone has helpfully already wrapped this in a Docker image. This gives us an opportunity to experiment with the Docker Python API:
lines 6:16: use the Docker Python API to dynamically create a container based on the alekzonder/puppeteer image
line 13: bind the current directory to /screenshots in the container so we can write the file somewhere accessible
line 15: set network_mode=host so the container can access Grafana on localhost
lines 23:38 will watch for new images being added to the directory and upload them
Start the Bot
With the monitoring stack running, you should be able to start the bot. From the slackbot directory:
$ python bot.py --config=config.yaml Bot is alive and listening for messages...
The bot can respond to a couple of basic requests, as below, and you can of course tailor the capabilities of a bot to the specific systems you want to monitor.
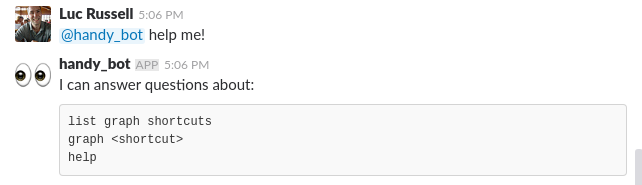 Respond to a help message
Conclusion
ChatOps bots can be useful assistants to help you operate a running system. This is a simplified use case, but the general concept can be extended to support more complex requirements.
Making use of the Docker API to dynamically create containers is a round about way to achieve the goal of capturing a screenshot, but this technique can be particularly useful when you need to quickly add a feature to your own application which has already been wrapped as a Docker image.
Simple ChatOps with Kafka, Grafana, Prometheus, and Slack was originally published in Hacker Noon on Medium, where people are continuing the conversation by highlighting and responding to this story.
Publication date
Disclaimer
The views and opinions expressed in this article are solely those of the authors and do not reflect the views of Bitcoin Insider. Every investment and trading move involves risk - this is especially true for cryptocurrencies given their volatility. We strongly advise our readers to conduct their own research when making a decision.