Latest news about Bitcoin and all cryptocurrencies. Your daily crypto news habit.
ADA surprised the market with a stellar performance, rallying by over 50% in the last three days.
Key Support levels: $0.60, $0.50
Key Resistance levels: $0.75, $0.90, $1
On May 28th, ADA found a new local bottom at around $0.45, and since then, it has been up only. The price has broken several key resistance levels moving to almost $0.66 at the time of this post. The current resistance is found at $0.75 and the support at $0.60.
ADA may also enter a consolidation period after such a significant move.
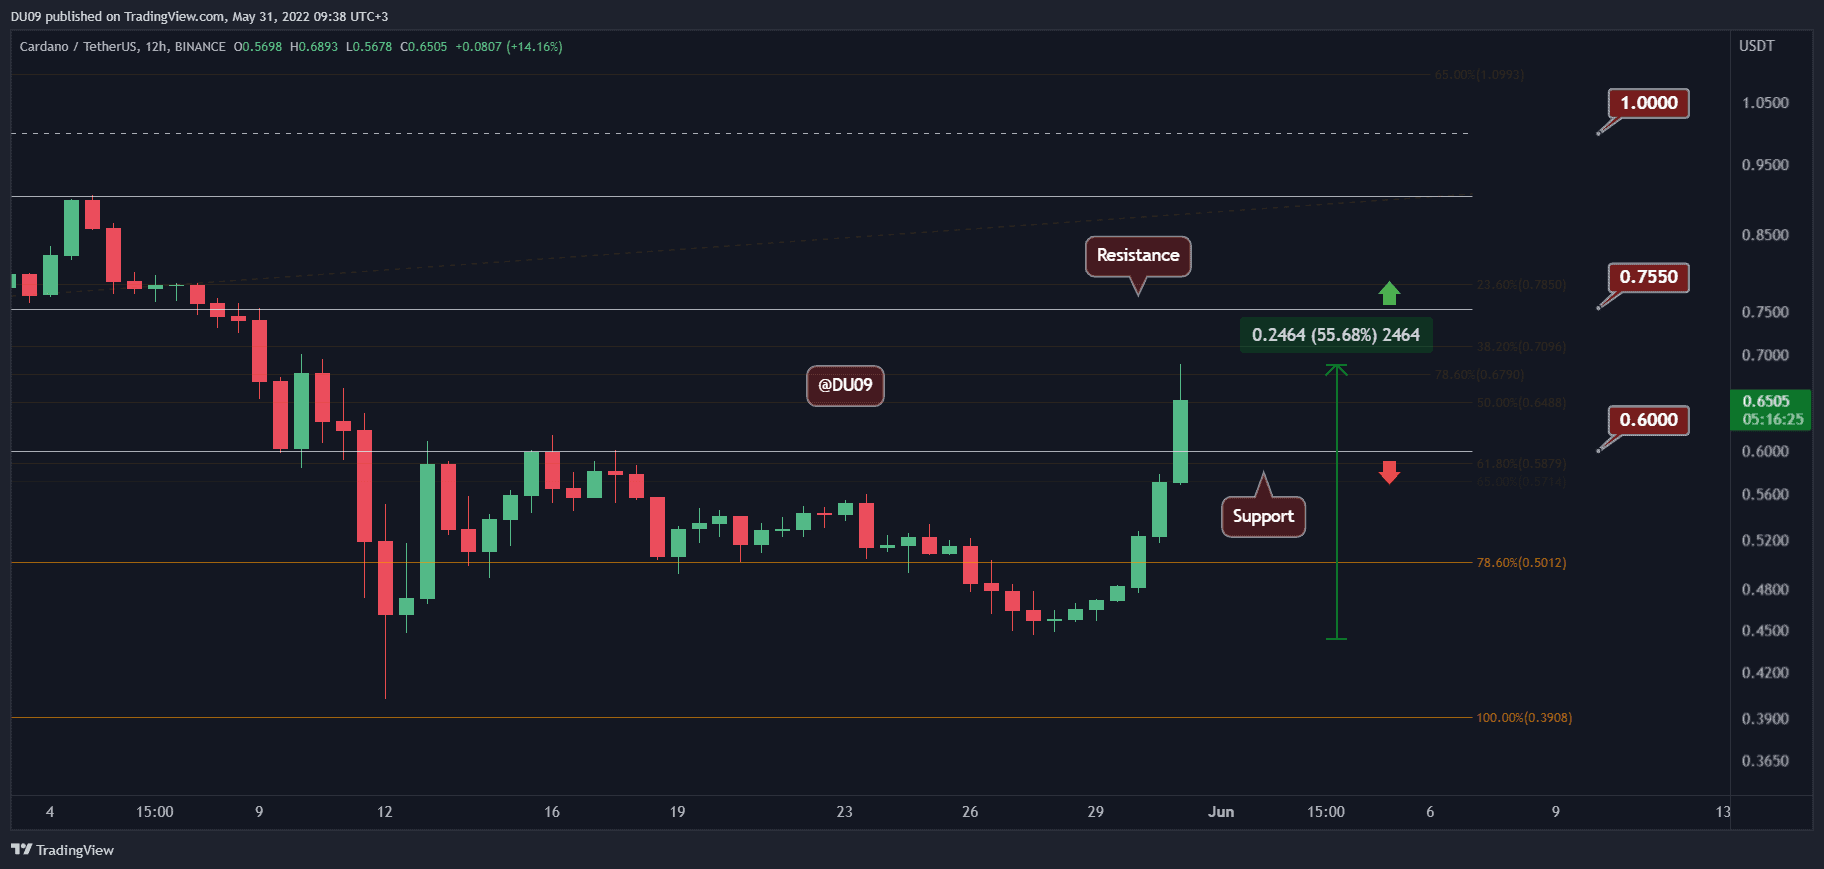
Chart by TradingView
Technical Indicators
Trading Volume: The strong buying volume in the past two days has propelled ADA’s price above half a dollar. Now. the bulls may try to consolidate following the success.
RSI: The daily RSI moved above 50 points, and this places it firmly on the bullish side. In the process, the RSI has also made a higher high.
MACD: The daily MACD is bullish, and the histogram is making higher highs with increased momentum. Buyers may continue to push the price even higher based on the MACD.
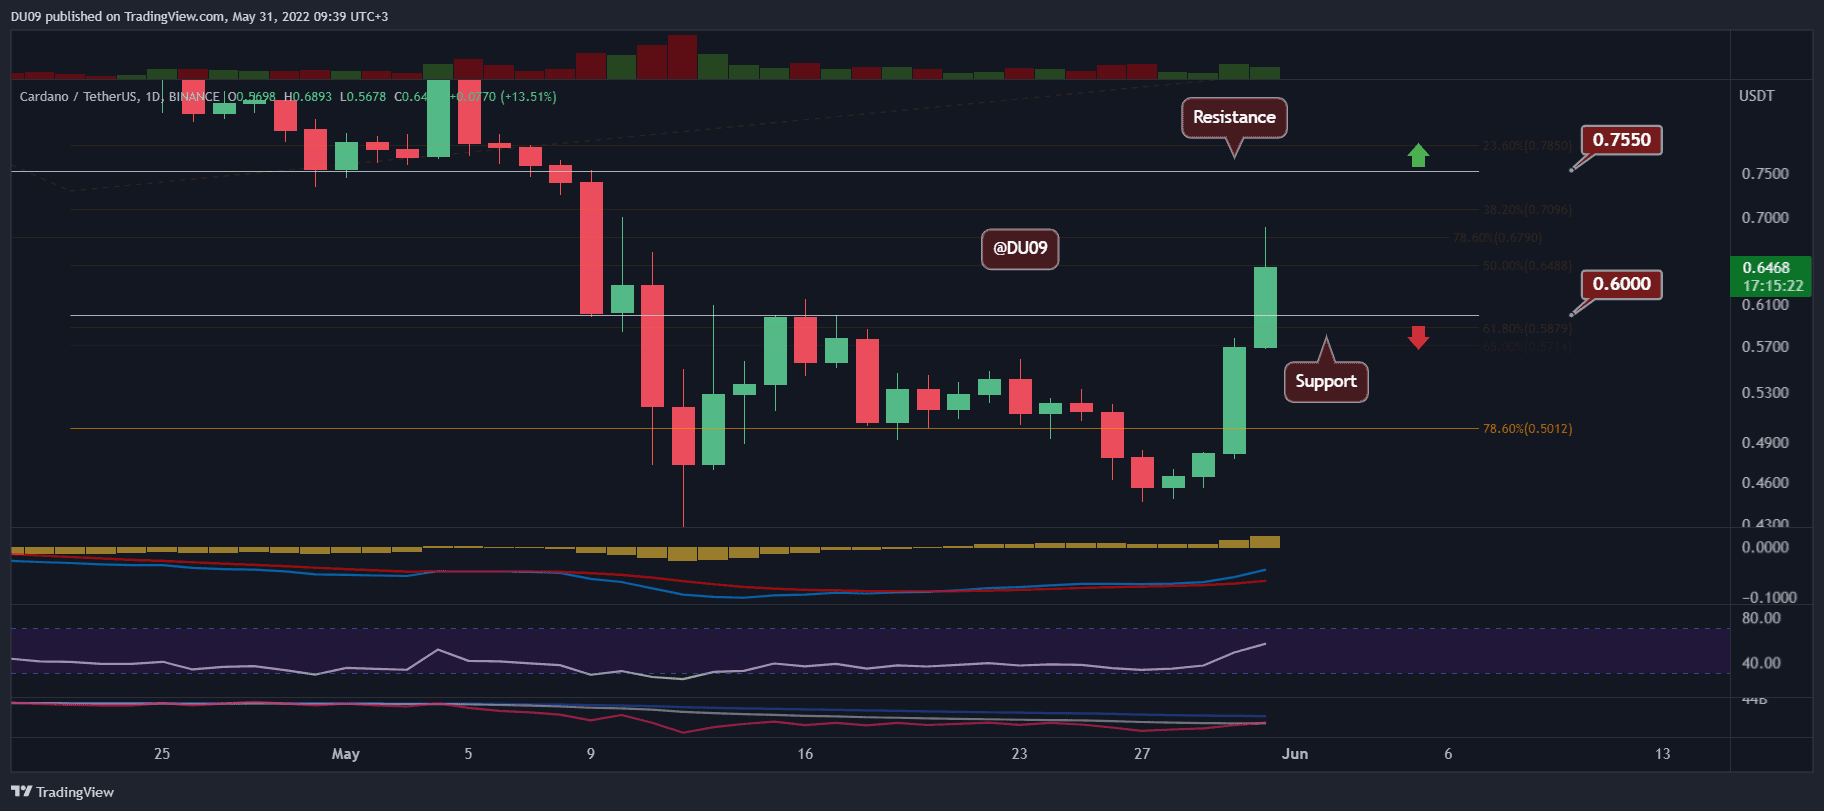
Chart by TradingView
Bias
The bias for ADA is bullish.
Short-Term Prediction for ADA Price
A test of the key resistance at $0.75 appears more likely, considering the indicators and market momentum at this time. Should ADA fail to move above this level, then the price may aim to consolidate above the support at $0.60.
Publication date
Disclaimer
The views and opinions expressed in this article are solely those of the authors and do not reflect the views of Bitcoin Insider. Every investment and trading move involves risk - this is especially true for cryptocurrencies given their volatility. We strongly advise our readers to conduct their own research when making a decision.