Latest news about Bitcoin and all cryptocurrencies. Your daily crypto news habit.
Over the past 24 hours, SOL crashed by a whopping 18% and is now found in a freefall.
Key Support levels: $23
Key Resistance levels: $37
With Solana losing its key support at $37 a while back, which has now turned into resistance, the price is well on its way to testing the next important level at $23. The sell-off has been sustained and continuous for the past three days with no signs of relief.

Chart by TradingView
Technical Indicators
Trading Volume: The selling volume is high and constant. Until this changes, it is unlikely for SOL to stop the downtrend.
RSI: The daily RSI already fell under 30 points and is found in the oversold area, but the price keeps going lower. The MACD is a much better indicator when searching for a bottom.
MACD: The daily MACD just completed a bearish cross today. This suggests the downtrend could intensify and that SOL is unlikely to be very close to its bottom just yet.
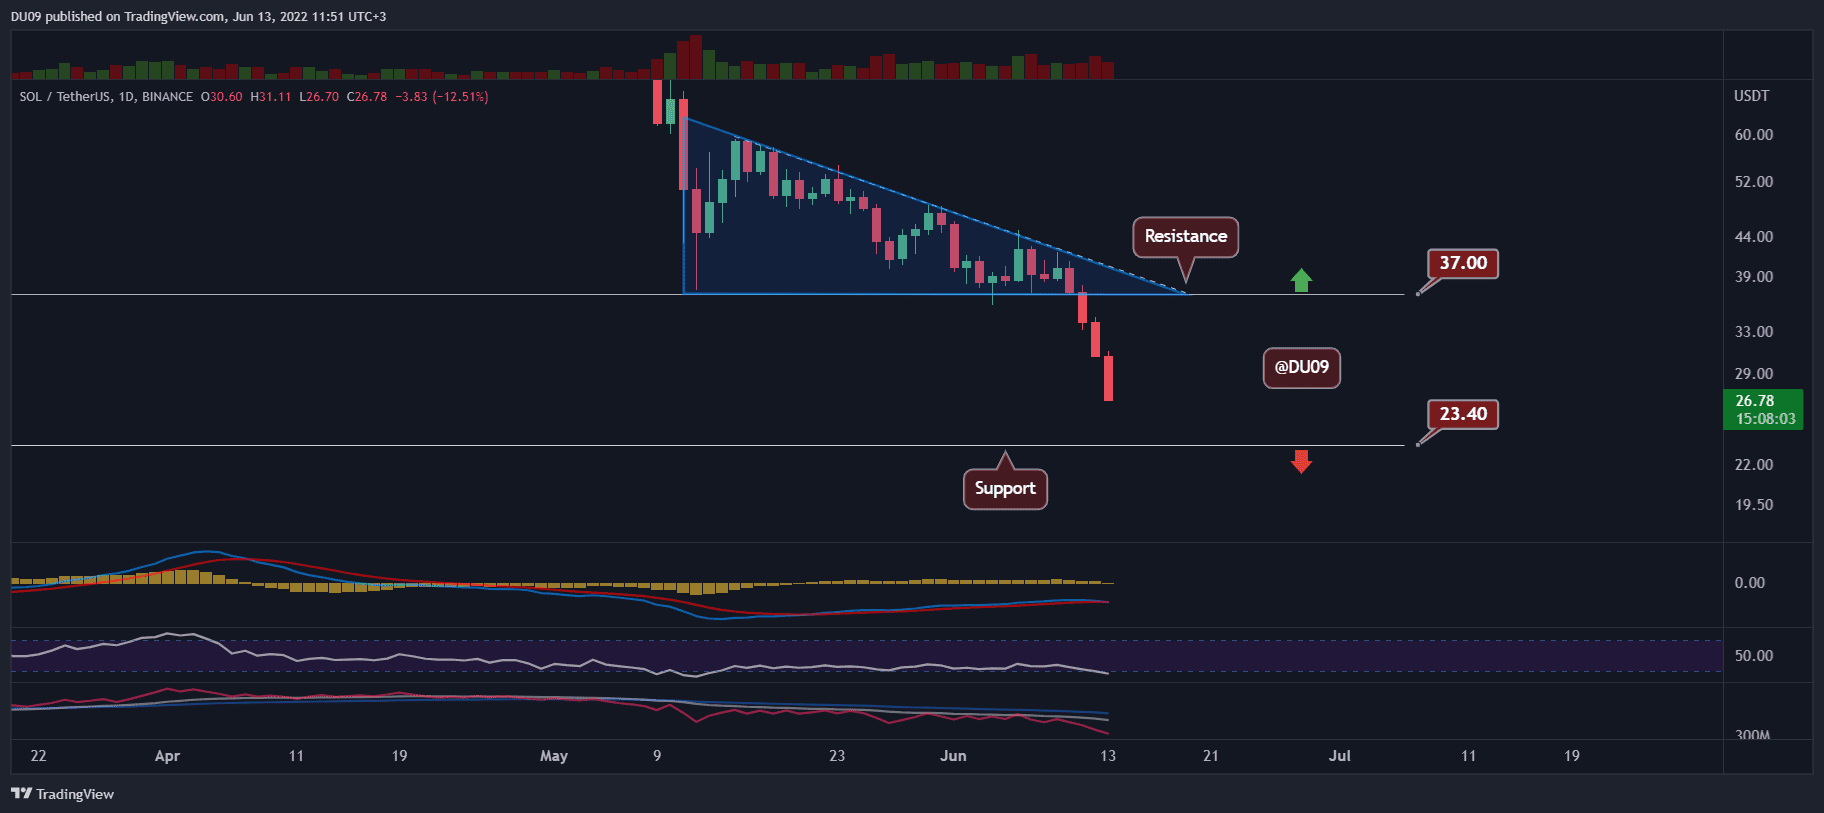
Chart by TradingView
Bias
The bias for SOL is bearish.
Short-Term Prediction for SOL Price
Without any relief in sight, it seems more likely to see Solana test the key support at $23. Should that level stop the current downtrend, then we might see a relief rally. This is also largely dependent on how BTC and ETH perform.
Publication date
Disclaimer
The views and opinions expressed in this article are solely those of the authors and do not reflect the views of Bitcoin Insider. Every investment and trading move involves risk - this is especially true for cryptocurrencies given their volatility. We strongly advise our readers to conduct their own research when making a decision.