Latest news about Bitcoin and all cryptocurrencies. Your daily crypto news habit.
FUD — Fear, Uncertainty and Doubt –Is Relief Rally Near?

Authored by Dave Chan, Researcher at Huobi Research Institute
Abstract
Readers will be able to formulate a live market indicator to quantify crypto market sentiments using Glassnode’s calculator to generate their own strategies after reading this market report. The following pain level indicator, market participation rate, dormancy flow, net capital loss including potential and realization of all market players, and whale accumulation momentum could become a key part their strategies.
On-chain liquidation price is also a key level to when watching out for the bottom. When the liquidation price of ETH ranged between US$1014 and US$1080, ETH bottomed and rebounded on June 15, 2022.
The institutional capitulation including 3 Arrows Capital, Celsius and the Ether Fund also drove the market down. Liquidation price of the institutions were lowered to avoid liquidation. Outstanding units of ETF funds were also lowered to reduce risk exposure for longs.
Such levels of Fear, Uncertainly and Doubt provide an undervalued opportunity for crypto natives.
1. Current state of the market
Meet our new friend. Mr Margin.

In the aftermath of the CPI announcement, the crypto market checked all the boxes for FUDs — fear, uncertainty and doubt with pain, in addition to the prospect of liquidation prices and institutional insolvency.
The following sections will analyze the market with quantitative emotional indicators as well as quant on-chain metrics to analyze market intervals. On-chain liquidation data also triggered institutions to mass panic to sell at a loss. These institutions include MicroStrategy and The Ether Fund (QETH.U).
1. Market indicator
The following three indicators suggest the market is nearing a bottom. This report, however, should not be utilized as a source for financial and investment advice.
Pain indicator:
The purpose of the indicator is to find the bottom through the measurement of pain level. Pain level is estimated by the number and intensity of market players feeling depressed by watching current prices. Finding the pain level in a quantitative model would attempt to estimate the ultimate market pain. Markets usually have a tendency to bottom when the pain level hits maximum tolerance.
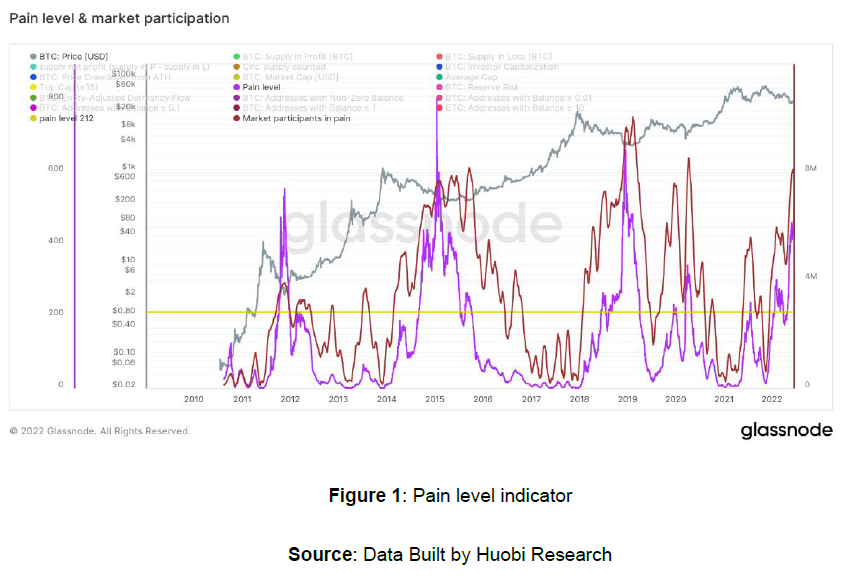
Brief market analysis: By viewing the pain level indicator, the market is experiencing a very high level of pain. This level of pain only existed 3 times during the market bottoms of 2019, 2015 and 2012. This indicator is highly suggesting that the market is close to its bottom as most market players are already in depression, in pain or have exited.
Pain Level = ($Top_marketcap — $price * circ_supply)
* btc_amount_in_loss/ circ_supply
* (address balance>0.1 BTC / address balance>0.01 BTC)
* (1/Entity-Adjusted Dormancy Flow)
($Top_marketcap — $price * circ_supply) measures price difference between near ATH price and price now, to measure the sentiment of those who sold at a loss and those who are watching the price level from its all-time high (ATH)
btc_amount_in_loss/ circ_supply measures the market participation in loss as a factor per circulating supply which is more frequently traded compared to illiquid non-circulating supply
This is calculated as the market participation in pain:
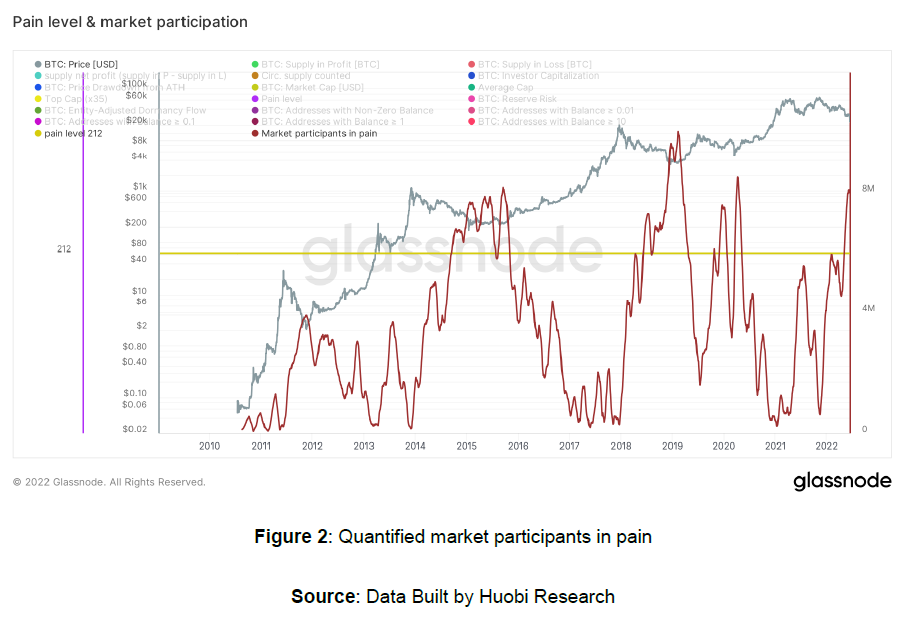
address balance>0.1 BTC / address balance>0.01 BTC measures the participation of serious market players out of participants who are willing to holding more than 0.01 BTC.
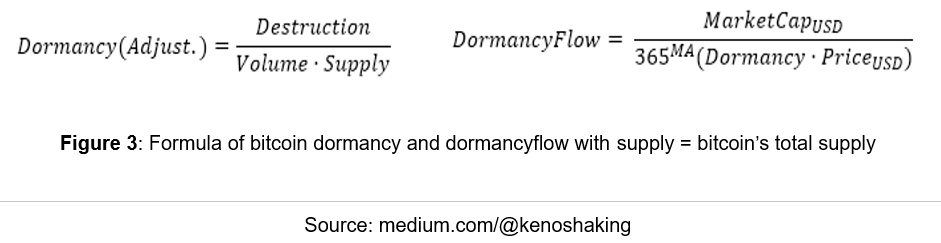
(1/Entity-Adjusted Dormancy Flow)= average of destroyed marketcap / (marketcap * volume)
The destroyed marketcap is referred to dormancy. Dormancy is the average number of days destroyed per coin transacted in any given day. A high level of dormancy refers to old coins that are destroyed for either market making or to force the market to panic sell when the whales are holding a large amount of coins. Factoring in the enforcement of panic sell behaviour into account, 1/dormancy flow is multiplied into the pain level indicator as a panic factor. It measures the tendency of panic sold marketcap as a proportion of the whole current marketcap to estimate the percentage of capital that was panic sold. Panic sold behaviour is thus analysed quantitatively.
Readers may have a glimpse of dormancy below:

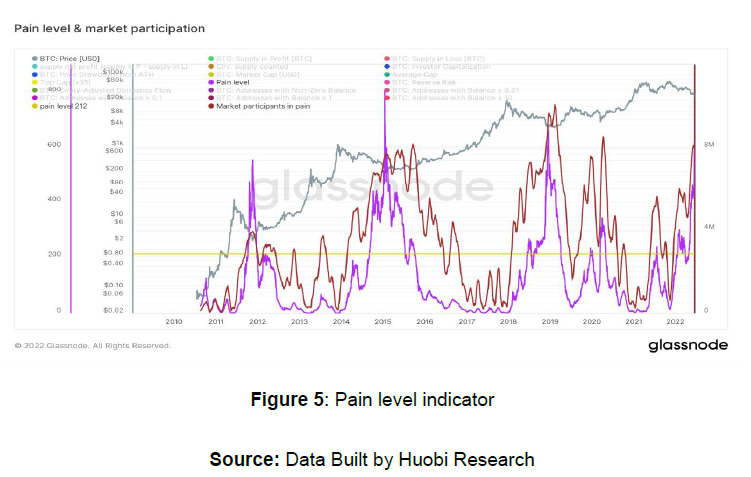

This indicator nearly hits ATH, higher than many of the bottoms like the 2020 and 2012 bear market bottoms as well as the bottom from last year. It means most of the market players are in deep pain. The pain level that crypto market players is currently experiencing has only occurred 3 times across the entire lifetime of the crypto market. It also serves as an inverse indicator to signal market bottoms across the 5 market bottoms. We are now ahead of possible final capitulations.
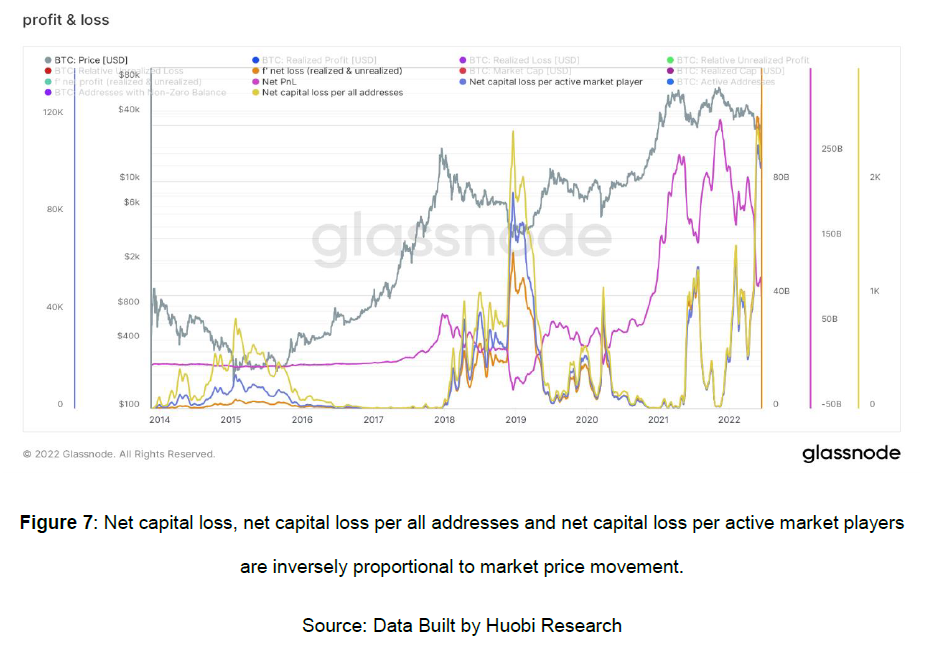
Net Capital Loss Indicator:
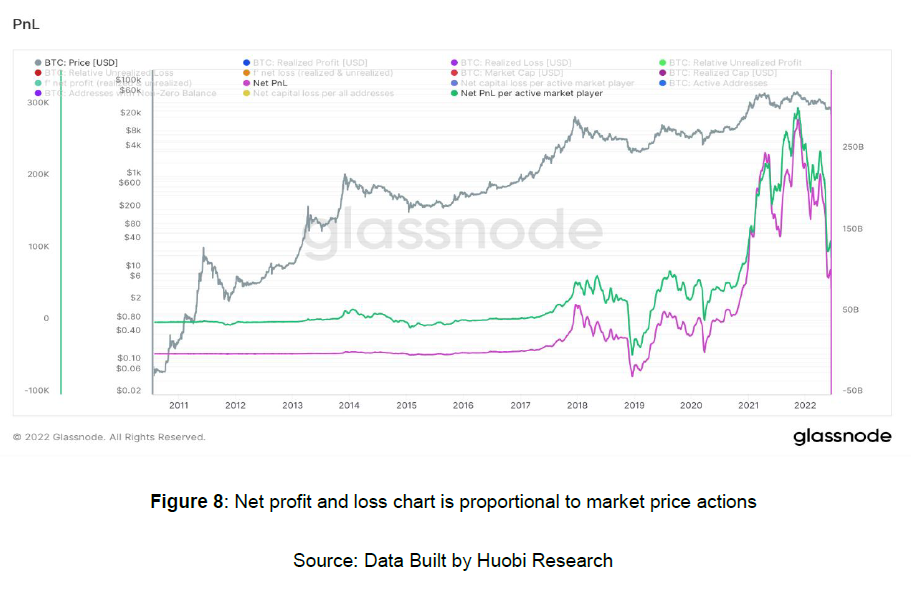
The net loss indicator calculates all realized and unrealized capital loss, adjusted by the multiple of current market capitalization. When all capital loss indicators indicate losses with active market players, it signifies market bottoms. The net capital loss per active market player and net capital loss per all addresses is achieved by dividing net capital loss per active market player and sum of all addresses. This balances off the proportion of capital loss with the growth of addresses. The balance is vital in indicating market sentiments. If only net loss is counted, we could see a 2x increase of the capital loss from the previous bottoms. This is not rational as net loss grows bigger owing to a growing marketcap. That is why the grown market capital loss is offset by the increase in wallet address growth. As both have grown, we can measure average loss per active market player and per bitcoin address.
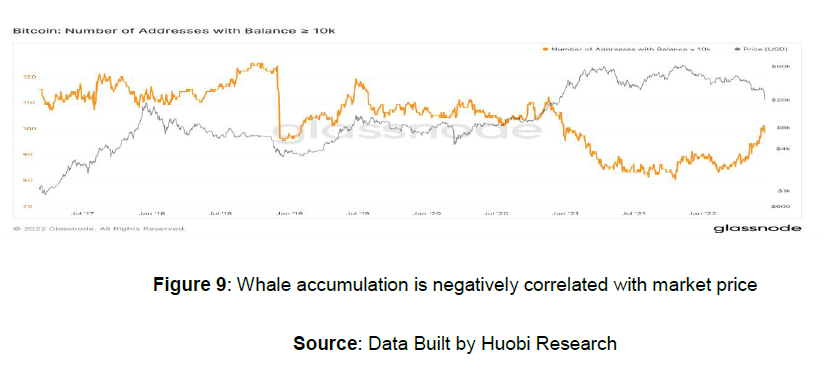
Big Whale Accumulation Indicator:
Here is the wallet accumulation chart of wallet addresses that have more than US$10,000 worth of BTC. An inversely proportional relationship began when the price of BTC rocketed and broke out at about US$20,000 since the bottoms observed during 2020. When the accumulation started, the market price action negatively correlated with the accumulation flow. This indicator signals a relative bottom due to the accumulation of BTC at lower prices.
3. On-Chain Liquidation and Institutional Panic
Eth liquidation price on AAVE, FUSE and Maker:
Eth fell to the price of US$1,015 at its low, and now its price has come across with the closed liquidation price of US$1,212 and a liquidation volume of around US$450 million. When Ethereum’s price fell, the stETH price also dropped in tandem which triggered a cascade of meltdowns for ETH’s derivative products. If stETH heads to the ratio of 0.8:1 of stETH:ETH, a liquidation volume close to US$350 million will be triggered.


Eth liquidation price with 3AC (3 Arrows Capital):
A liquidation price range of between US$1,080 and US$1,014 for Ethereum will trigger a collateral meltdown. According to Wu blockchain, the liquidation price of Ethereum of Three Arrows Capital is about US$1,014.


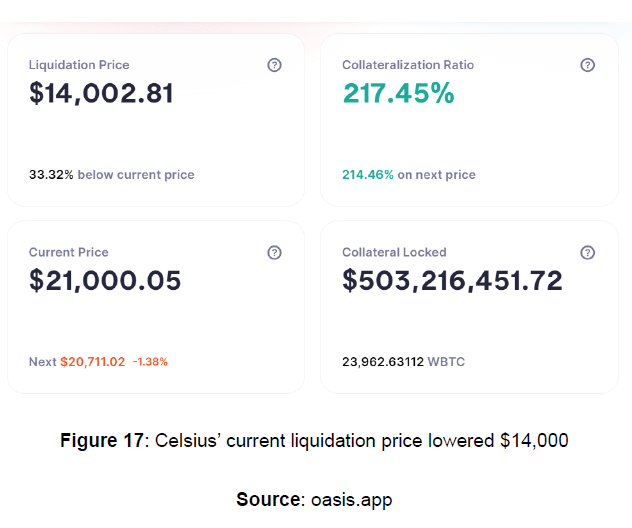
Celsius meltdown:
The liquidation price of US$20,272 of WBTC has caught the eye of market players. On June 13, the liquidation price of WBTC might have triggered a potential meltdown of US$478 million worth of collateral for Celsius.

Since Celsius is actively paying back its debt, on early June 14, the liquidation price lowered to US$16,852.

Institutional Capitulations:
Institutions’ unrealized capital loss is reflected across social media.


The Ether Fund (QETH.U) Outstanding Units were also reduced to be sold as a loss. According to Glassnode, the holdings of QETH.U were reduced during the market crash, and a part of the holdings was sold as a loss.

4. Conclusion
Major market FUDs and pain level have been reflected by indicators. Behavioral traits of retail investors are against whales, meaning that they are inversely correlated. On-chain liquidations have triggered a cascade of draw-downs. The Market is experiencing a moment of capitulations. Investors are reminded to manage portfolio risks and acknowledge maximum drawdown.
About Huobi Research Institute
Huobi Blockchain Application Research Institute (referred to as “Huobi Research Institute”) was established in April 2016. Since March 2018, it has been committed to comprehensively expanding the research and exploration of various fields of blockchain. As the research object, the research goal is to accelerate the research and development of blockchain technology, promote the application of blockchain industry, and promote the ecological optimization of the blockchain industry. The main research content includes industry trends, technology paths, application innovations in the blockchain field, Model exploration, etc. Based on the principles of public welfare, rigor and innovation, Huobi Research Institute will carry out extensive and in-depth cooperation with governments, enterprises, universities and other institutions through various forms to build a research platform covering the complete industrial chain of the blockchain. Industry professionals provide a solid theoretical basis and trend judgments to promote the healthy and sustainable development of the entire blockchain industry.
Official website:
Consulting email:
research@huobi.com
Twitter: @Huobi_Research
https://twitter.com/Huobi_Research
Medium: Huobi Research
https://medium.com/huobi-research
Disclaimer
1. The author of this report and his organization do not have any relationship that affects the objectivity, independence, and fairness of the report with other third parties involved in this report.
2. The information and data cited in this report are from compliance channels. The sources of the information and data are considered reliable by the author, and necessary verifications have been made for their authenticity, accuracy and completeness, but the author makes no guarantee for their authenticity, accuracy or completeness.
3. The content of the report is for reference only, and the facts and opinions in the report do not constitute business, investment and other related recommendations. The author does not assume any responsibility for the losses caused by the use of the contents of this report, unless clearly stipulated by laws and regulations. Readers should not only make business and investment decisions based on this report, nor should they lose their ability to make independent judgments based on this report.
4. The information, opinions and inferences contained in this report only reflect the judgments of the researchers on the date of finalizing this report. In the future, based on industry changes and data and information updates, there is the possibility of updates of opinions and judgments.
5. The copyright of this report is only owned by Huobi Blockchain Research Institute. If you need to quote the content of this report, please indicate the source. If you need a large amount of reference, please inform in advance (see “About Huobi Blockchain Research Institute” for contact information) and use it within the allowed scope. Under no circumstances shall this report be quoted, deleted or modified contrary to the original intent.

FUD — Fear, Uncertainty and Doubt –Is Relief Rally Near? was originally published in Huobi Research on Medium, where people are continuing the conversation by highlighting and responding to this story.
Publication date
Disclaimer
The views and opinions expressed in this article are solely those of the authors and do not reflect the views of Bitcoin Insider. Every investment and trading move involves risk - this is especially true for cryptocurrencies given their volatility. We strongly advise our readers to conduct their own research when making a decision.