Latest news about Bitcoin and all cryptocurrencies. Your daily crypto news habit.
The buyers stepped in for Solana as they managed to take the cryptocurrency above $44.
Key Support levels: $44
Key Resistance levels: $59
Solana managed to break the key resistance at $44 and turned it into support. In doing so, SOL surged past the ascending triangle, which is now being tested as support. If this level is maintained for the mid-term, then the path to $59 becomes easier.
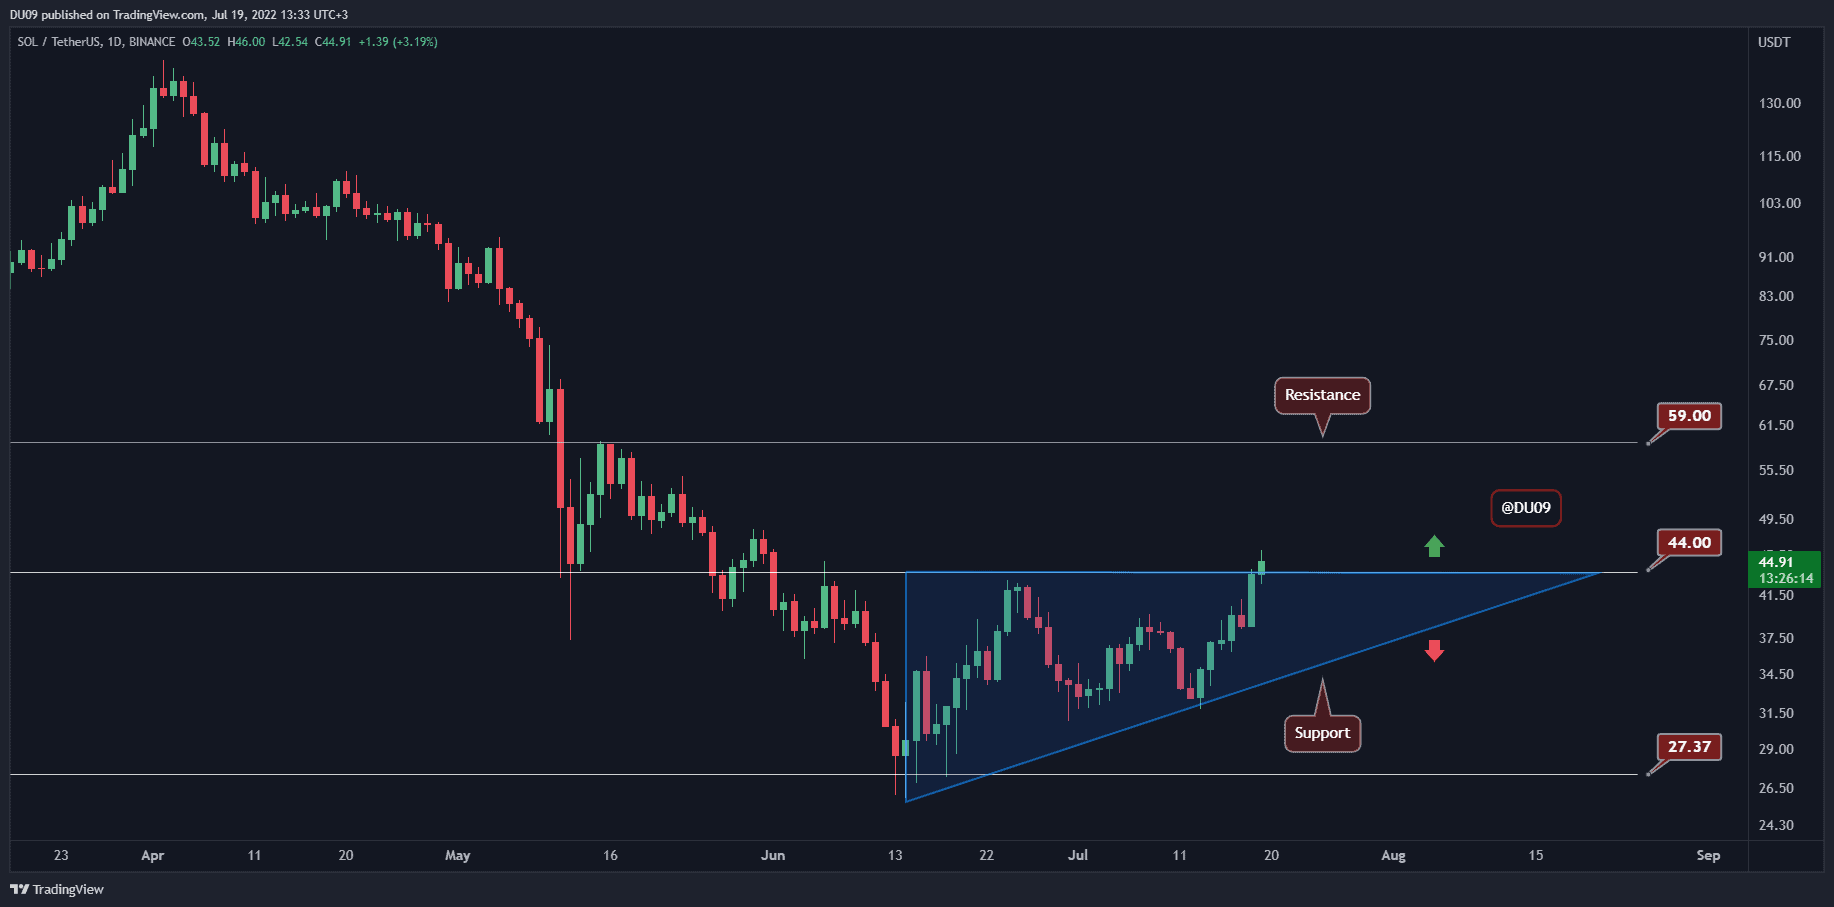
Chart by TradingView
Technical Indicators
Trading Volume: The buying volume increased sharply yesterday, which allowed the price to rally all the way to $44. Today, buyers were a bit timider but still managed to push SOL above this key level.
RSI: The daily RSI exploded higher and is not closing in to 70 points which would place it in the overbought area. This is bullish.
MACD: The daily MACD is bullish with expanding moving averages and histogram. The momentum favors bulls right now, and there are no signs of weakness.
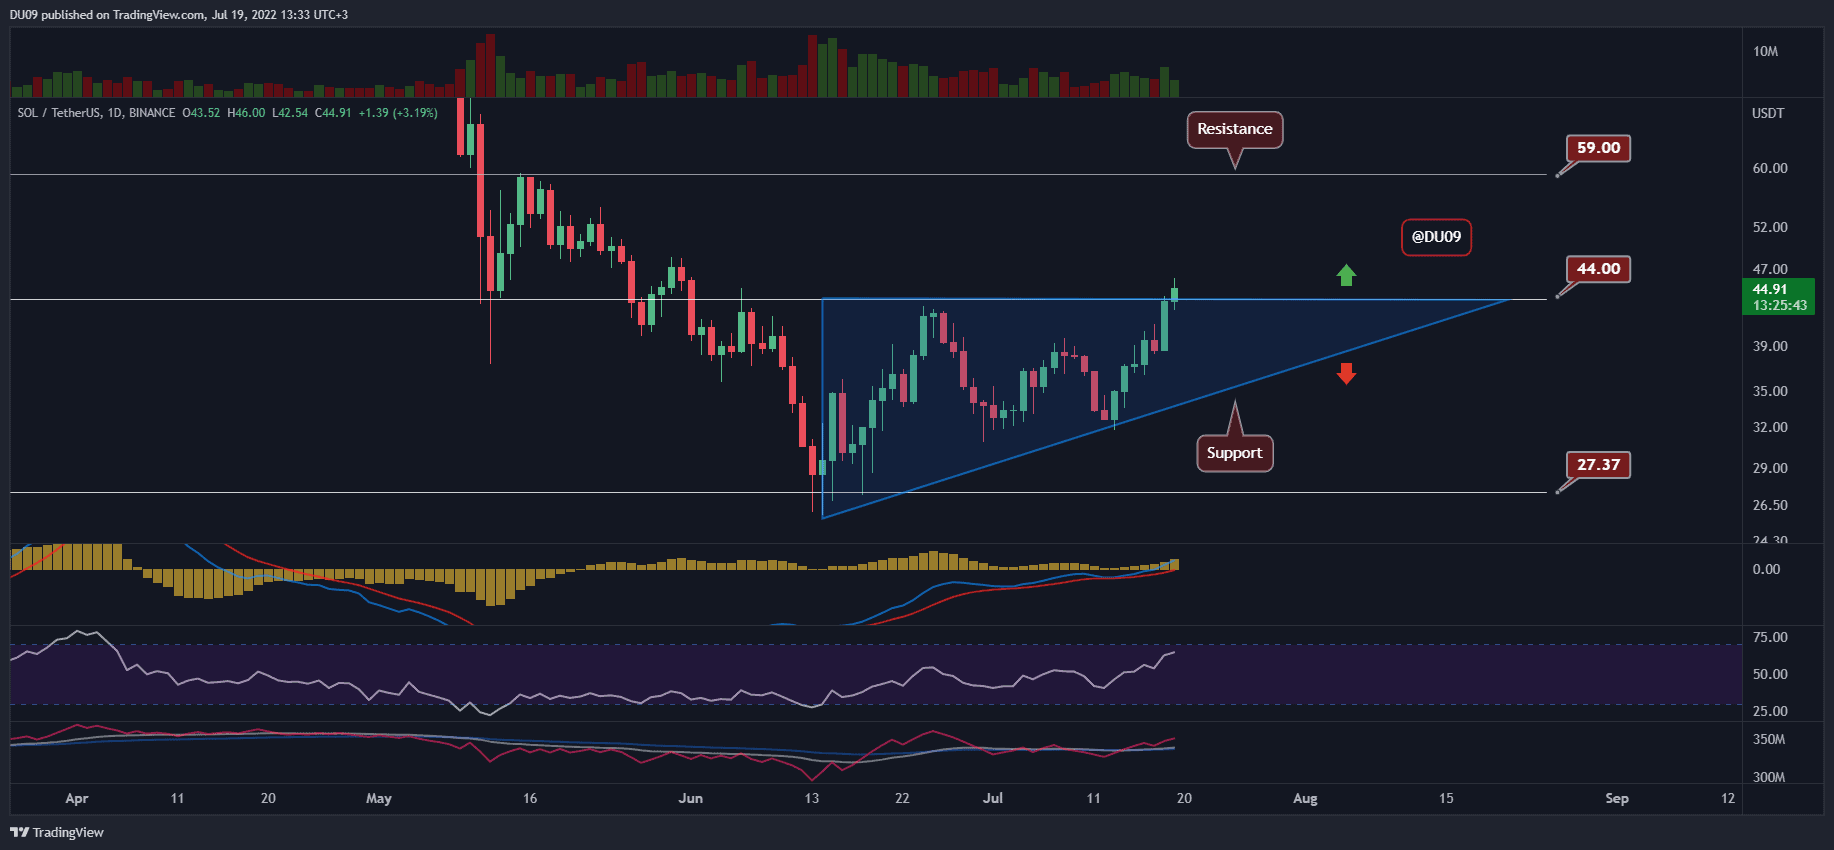
Chart by TradingView
Bias
The short-term bias for SOL is bullish.
Short-Term Prediction for SOL Price
Solana just flashed a considerable change in its mid-term trend with this latest breakout. If the buyers manage to keep its price above $44, then they will likely have total control of the market momentum – at least until the next key resistance at $59.
Publication date
Disclaimer
The views and opinions expressed in this article are solely those of the authors and do not reflect the views of Bitcoin Insider. Every investment and trading move involves risk - this is especially true for cryptocurrencies given their volatility. We strongly advise our readers to conduct their own research when making a decision.