Latest news about Bitcoin and all cryptocurrencies. Your daily crypto news habit.
Solana made a higher high, and then the price quickly reversed course.
Key Support levels: $35, $27
Key Resistance levels: $44, $59
After a sustained rally that took SOL’s price above the ascending triangle, bears took over the market and pushed the cryptocurrency back under the key resistance at $44, where the bulls failed to step up and lost the level. For this reason, the next key support is now found at $35.
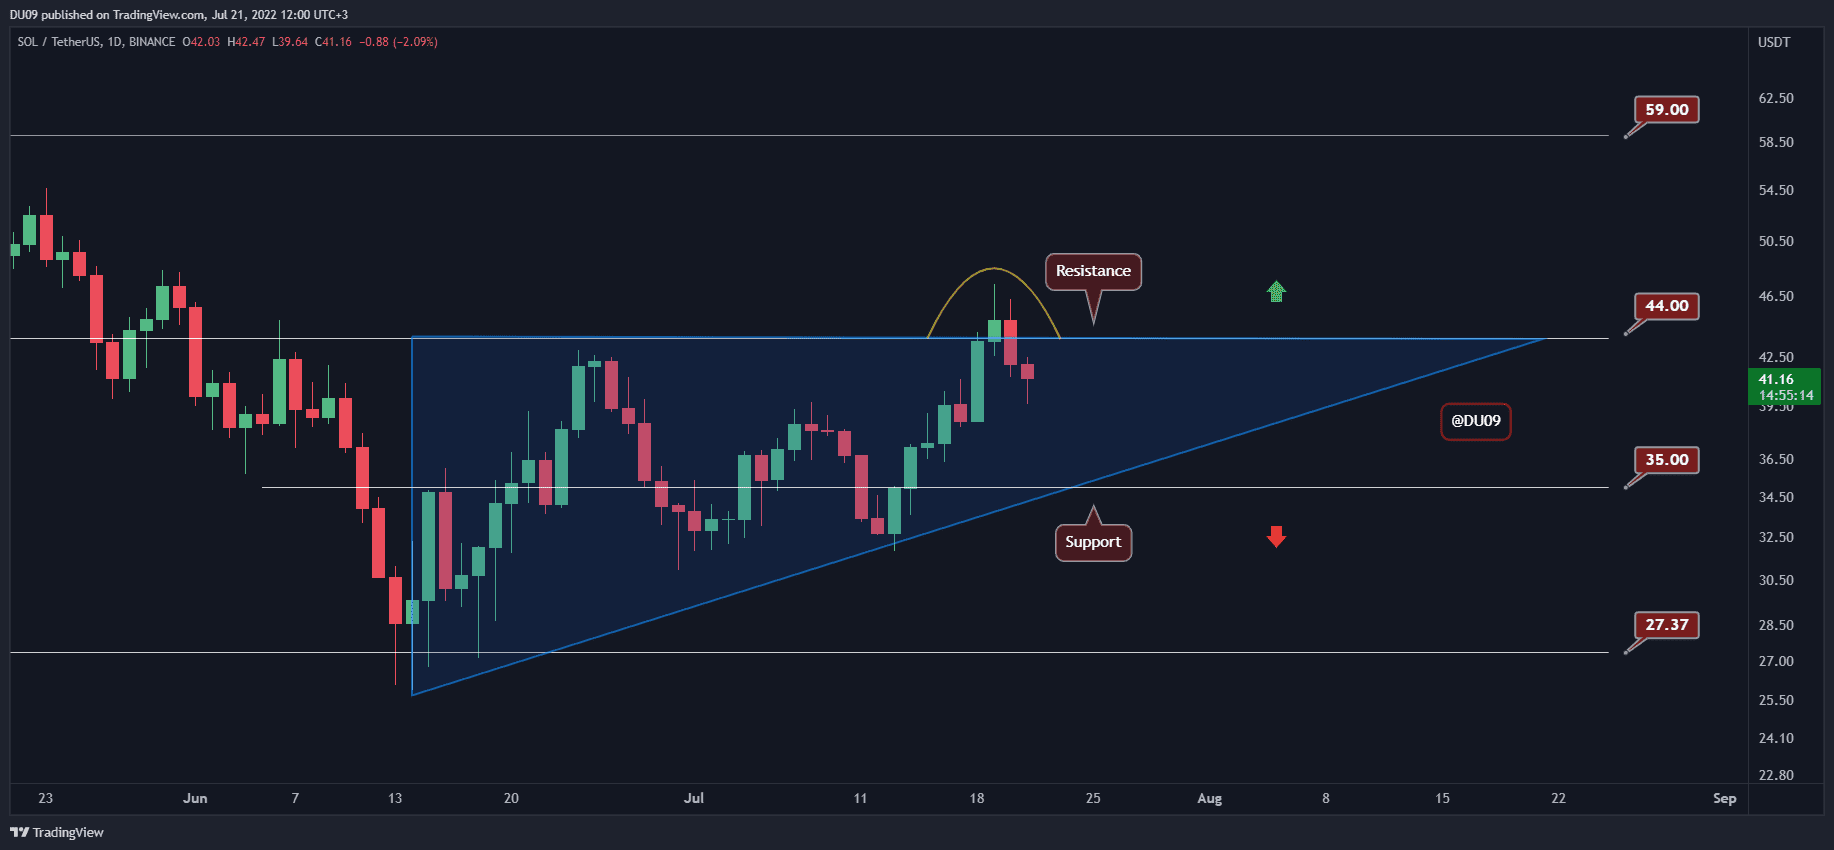
Chart by TradingView
Technical Indicators
Trading Volume: The volume turned red in the past two days. Nevertheless, the selling volume is low, and bulls may retake control soon.
RSI: The daily RSI exploded higher earlier this week but now quickly reversed towards 50 points. As long as the RSI stays above 50 points, SOL can continue up.
MACD: The daily MACD is bullish. Even if the buying momentum faded a bit, Solana seems positioned to explore higher levels.
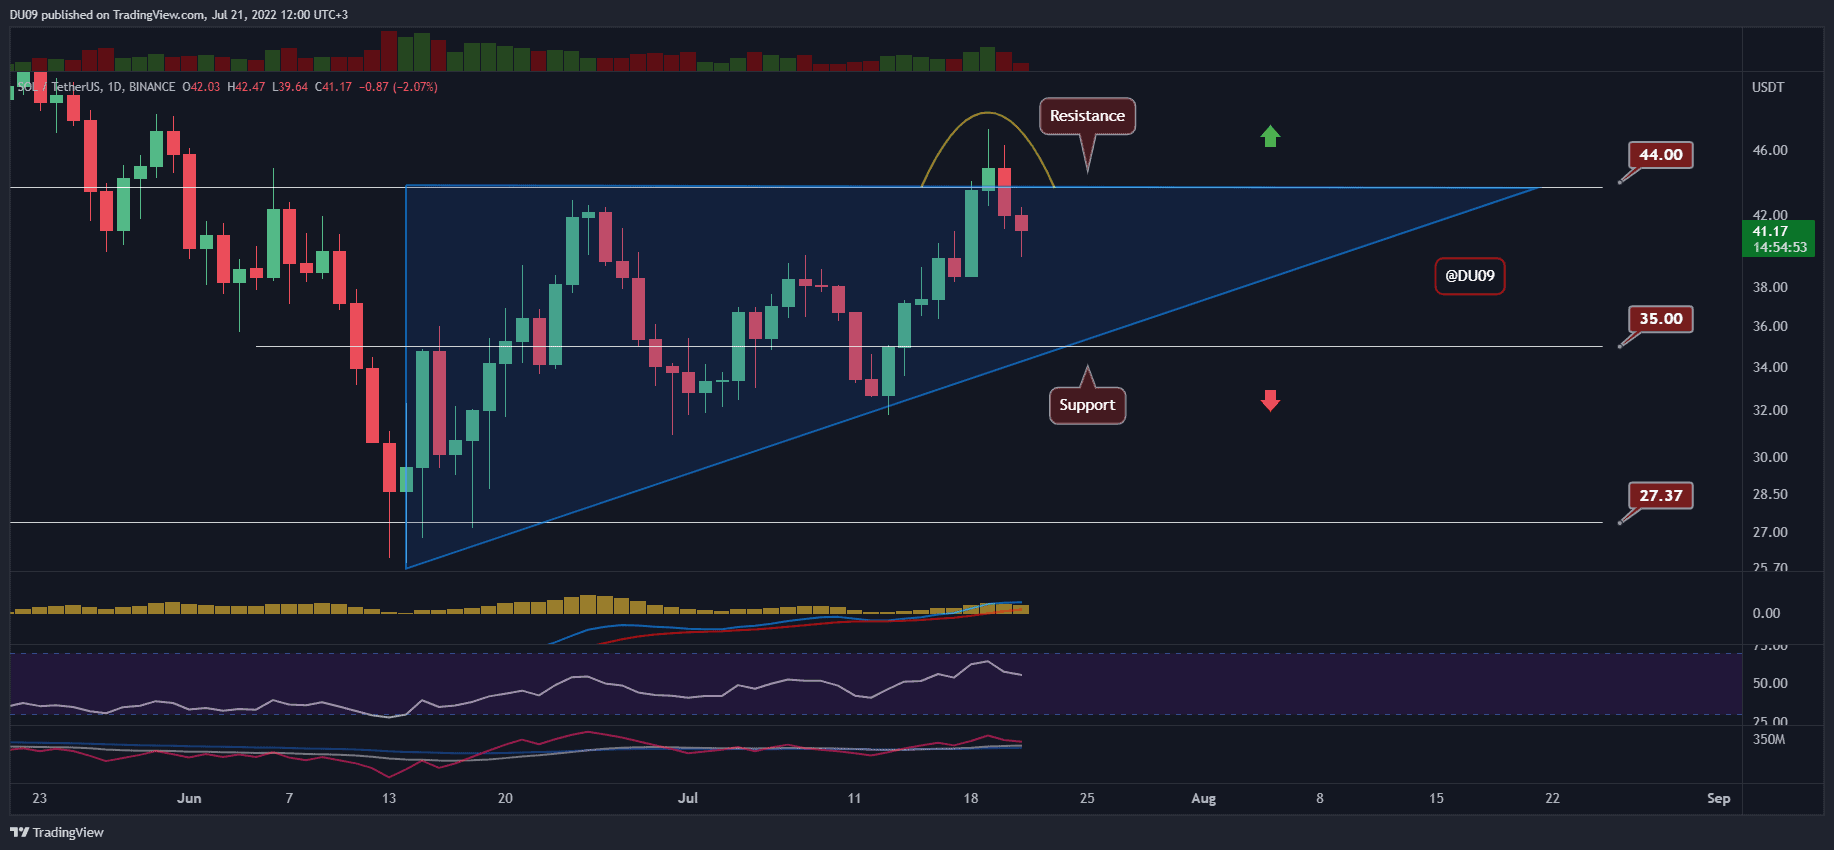
Chart by TradingView
Bias
The short-term bias for SOL is bullish.
Short-Term Prediction for SOL Price
Despite this correction, Solana managed to make a higher high, and if buyers return, then SOL’s price could move much higher in the coming week. If the $44 resistance falls again, then bulls can target $59. As long as the critical support at $35 holds, Solana remains in an uptrend.
Publication date
Disclaimer
The views and opinions expressed in this article are solely those of the authors and do not reflect the views of Bitcoin Insider. Every investment and trading move involves risk - this is especially true for cryptocurrencies given their volatility. We strongly advise our readers to conduct their own research when making a decision.