Latest news about Bitcoin and all cryptocurrencies. Your daily crypto news habit.
How NFT metrics such as volume traded and number of collections created help understand market cycles
Most NFT market analysis seen so far tends to overfocus on the daily volume traded by NFTs. As our avid readers might have realized, this is a metric with a lot of noise. It varies greatly depending on stationality, popular collections launching, or crypto market shocks. It is a confusing metric to build conclusions from if one just takes single data points as a basis. From an economic perspective, it is a metric that is also lacking if used alone. It makes sense to measure both supply and demand when analyzing market forces. Through variations in these we can better understand the dynamics driving NFT boom and bust cycles.
For these reasons at IntoTheBlock we show in our analytics the cumulative number of NFT collections as a measurement of supply, and cumulative volume traded by NFTs as a demand indicator. The choice to use cumulative values instead of daily is to try to easily visualize changes in trends over the long term. These changes allow us to easily spot how supply and demand relate to each other.
This idea can be seen in the chart below, the volume traded by NFTs, in black, had a period at the start of the year that caused a shift in the trend that was maintained during the last quarter of 2021. Market in red can be seen how its volume traded doubles from $20BN to $40BN just in 2 months. The supply side, the number of collections being created did not react to this large market demand until 2 months later, when the rate of the number of collections being offered started to accelerate and catch up:

Cumulative volume of traded on NFTs and cumulative number of NFT collections created by IntoTheBlock NFT analytics.
That period of high demand and relatively constrained supply, can be understood as a growth of the interest over NFTs most likely caused by an inflow of new traders entering the market. These reasons caused the price of many popular collections to grow substantially. The recent market cooldown has clearly caused an interest drop over NFTs. It can be seen in red how around June 22, the volume traded by NFTs started to decrease compared to the figures seen before. In contrast, this time the demand is not being reduced: there are still a large number of new collections that are launched daily, as can be seen how the blue line does not show signs of slowing down. But how many collections are launched daily? Are there so many? Let’s look at what the daily data show us.
The previous conclusion can be validated if we take a look at daily data, instead of cumulative. This time in blue is shown the daily volume traded by NFTs, and in black the daily number of collections that are being created. At the start of the year the number of collections launched daily was relatively constant at around 100 to 200 collections (this might surprise many readers, but attention and media is usually just focused on those few that have overperformed greatly).When the early 2022 craze started, trading volumes rose from $100M to almost reaching $1BN a couple of days. That is a x10 in demand in barely 2 months, while the supply of collections being created daily was kept constant at 200–250 collections.
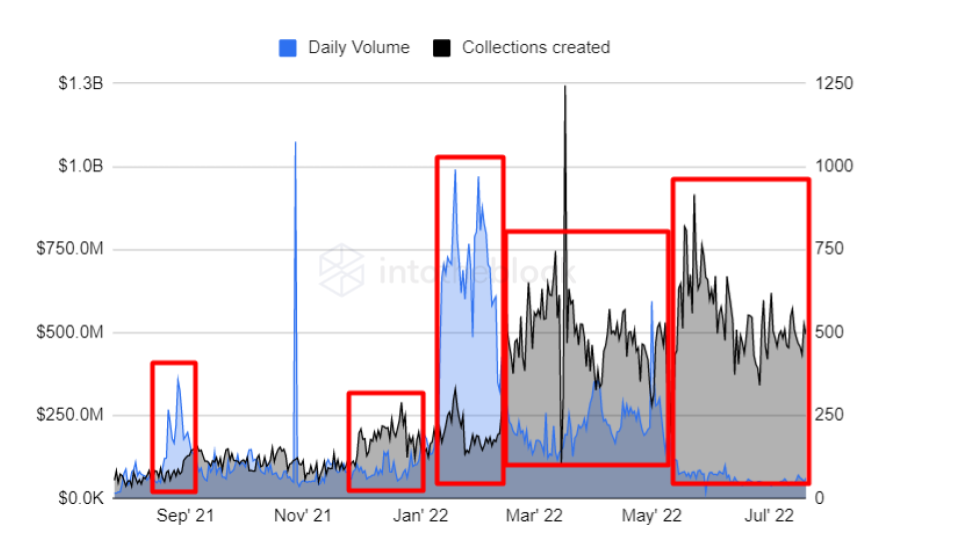
Daily volume traded by NFTs and daily number of NFT collections created by IntoTheBlock NFT analytics.
The NFT creators reacted 2 months later, when the number of collections being offered more than doubled, reaching 500–700 new collections per day. It is astonishing that one day it reached an all time high of 1250 new collections being created in a single day (supposing 10K tokens per collection that would be an inflow 12.5M of unique NFTs). It is marked in red all the divergences that the NFT market has experienced so far. Other times these imbalances were the opposite, the most extreme example is the current market condition. With more than 500 new collections being released but with demand levels remaining consistently low with levels not seen since the fall of 2021. These imbalances affect NFT prices greatly, making popular collections very sensitive to these supply and demand waves.
Besides these market overviews, the exogenous and endogenous sources that impact the pricing of NFTs of popular collections are not well understood yet. An example of this is how differently the prices of these NFT collections behave compared to other crypto assets such as Coins or tokens. For example most of these coins possess a strong correlation and lately have a direct relationship with macroeconomic conditions US equities markets. Is not the case for popular NFT collections such as Bored Ape Yacht Club (BAYC) or Cryptopunks, as can be seen their median daily price in the next chart:
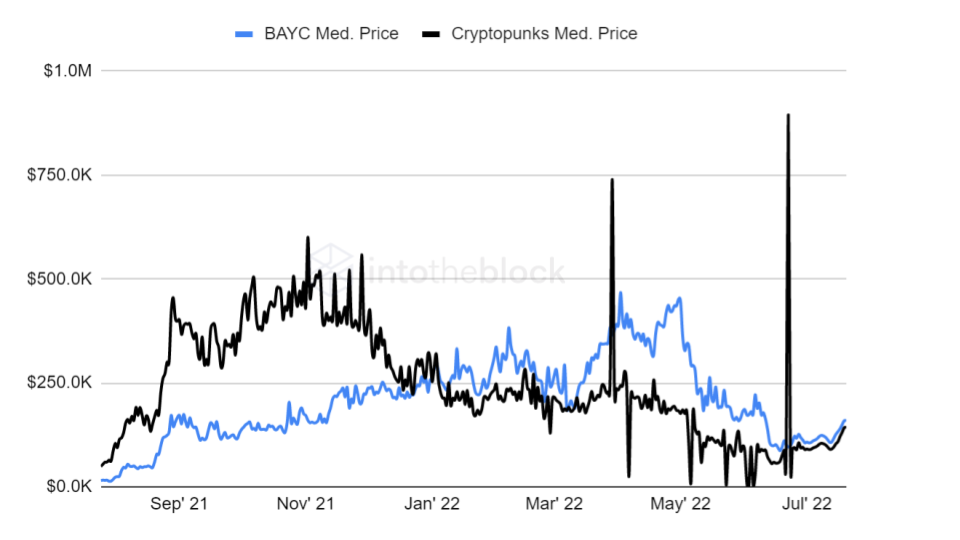
Daily median price of Bored Ape Yacht Club and Cryptopunks according to our (upcoming) NFT Collections analytics.
These are the two most valuable NFT collections and still can be seen how until now they had little correlation. Some spikes on Cryptopunks are related to rare pieces being acquired at very high prices, or days that had 0 volume due to the lack of transactions in that day, something common on a collection where the median price is over $100K.
We are probably still far from having an understanding of NFT prices as complete as we might have for other crypto assets. The NFT market is still at early stages, and new tools and analytics can help us to better comprehend how these illiquid assets behave very differently to others. This is one of the reasons why at IntoTheBlock, we are preparing a second set of onchain analytics focused on understanding how blockchain activity relates with pricing data. These will be releasing soon, so keep an eye on our social media channels for the upcoming release.
The NFT Market Cooldown As Supply And Demand Imbalances was originally published in IntoTheBlock on Medium, where people are continuing the conversation by highlighting and responding to this story.
Publication date
Disclaimer
The views and opinions expressed in this article are solely those of the authors and do not reflect the views of Bitcoin Insider. Every investment and trading move involves risk - this is especially true for cryptocurrencies given their volatility. We strongly advise our readers to conduct their own research when making a decision.