Latest news about Bitcoin and all cryptocurrencies. Your daily crypto news habit.
They say bear markets are for building and that’s exactly what we’re doing. We’re happy to release another valuable update to IntoTheBlock Analytics just before the end of the year. We’ve improved several indicators and metrics including network value to transaction ratio, transaction volume & count by size, and many more!
There are 7 main improvements to IntotheBlock’s blockchain analytics platform that will help you get additional insights and guide your trading decisions. Let’s have a look at the changes.
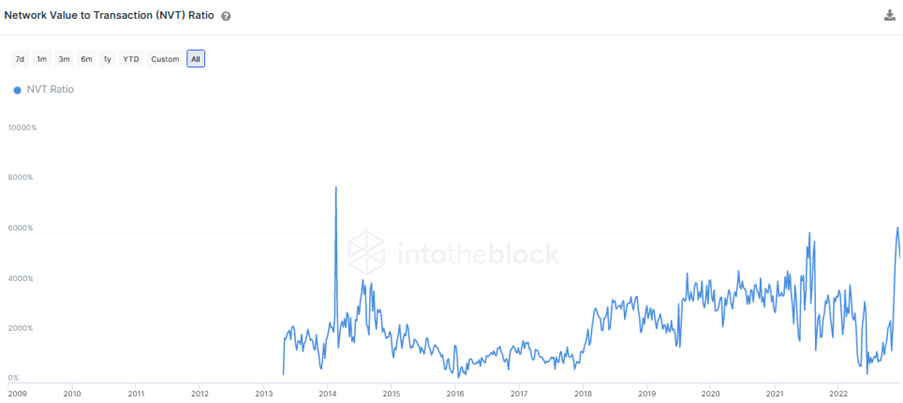
Network Value to Transaction Ratio (Financial)
We’re introducing a new indicator to IntoTheBlock. The Network Value to Transaction (NVT) Ratio shows the ratio of market cap to transacted value in dollars. This can give insight into to what extent the market cap relates to actual economic activity on a network.
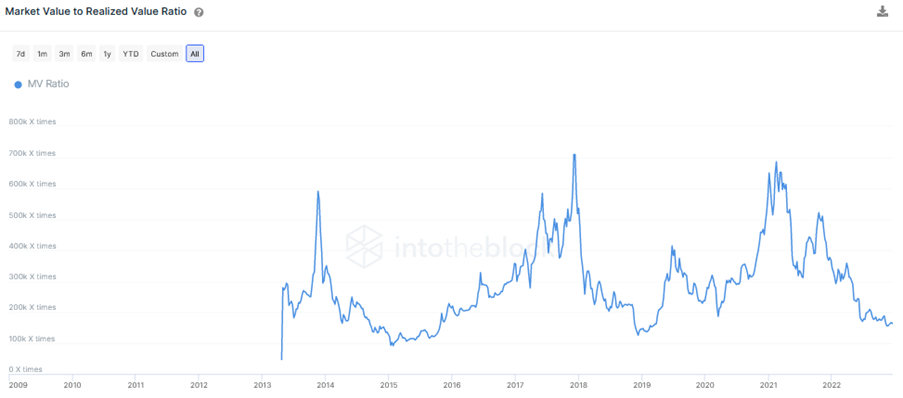
Market Value to Realized Value Ratio (Financial)
The next indicator we are adding to IntoTheBlock Analytics is the Market Value to Realized Value Ratio (MV Ratio). This indicator shows the ratio of Market Cap to the average purchasing cost of each address.
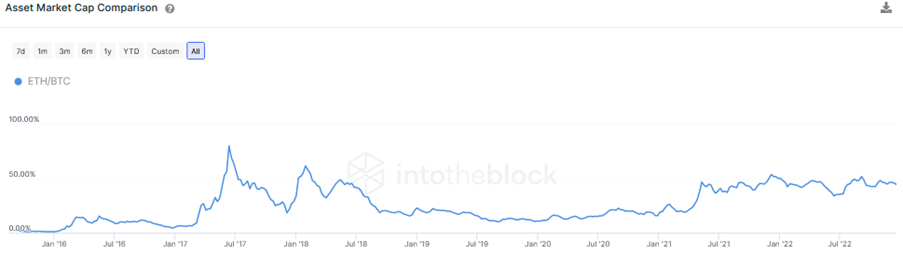
Asset Market Cap Comparison (Financial)
The Asset Market Cap Comparison is a new indicator that shows a comparison of the market capitalization of an asset over time compared to BTC and ETH. This is specifically useful to see how an asset is performing against the major assets.
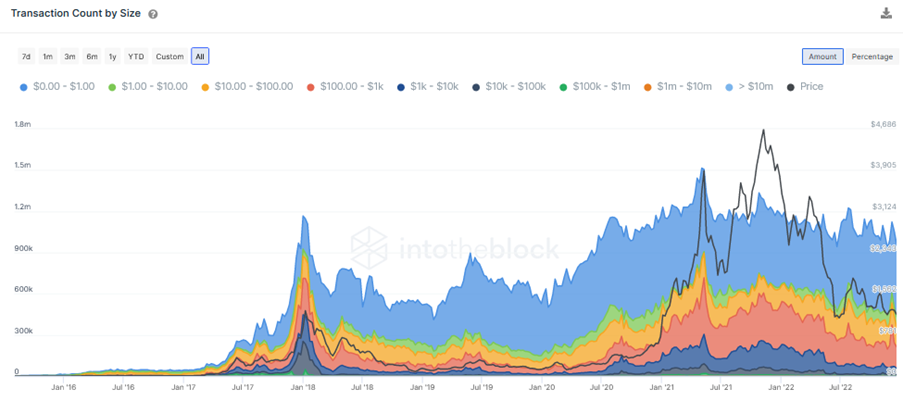
Transaction Count by Size or Volume (Network)
We have two new indicators in the network section related to transaction count. Namely, transaction count by size and transaction count by volume. This helps to give a more in-depth view of how the network is being used.
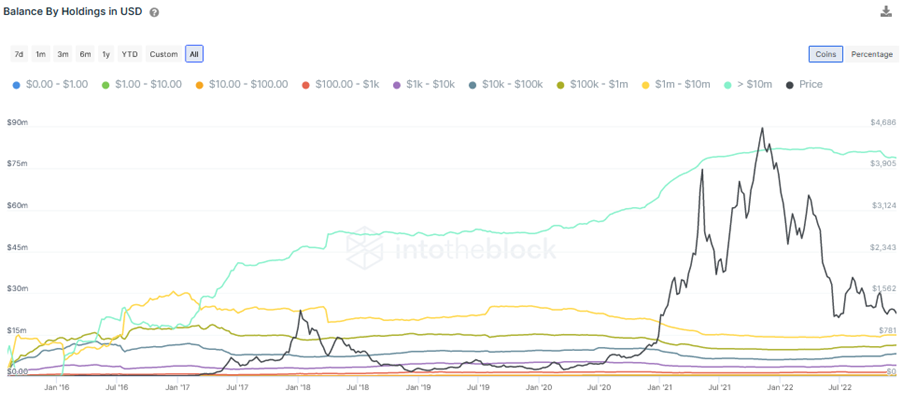
Balance By Holdings in USD (Ownership)
The following chart is something we already had available in the native asset of the network in question. However, as valuations change, it makes sense to show the Balance by Holdings in USD to gain a better perspective on the situation. In general, this is helpful to understand the distribution of value in the network. This can be displayed in terms of the aggregate amount of crypto held or the percentage they make out of the circulating supply.
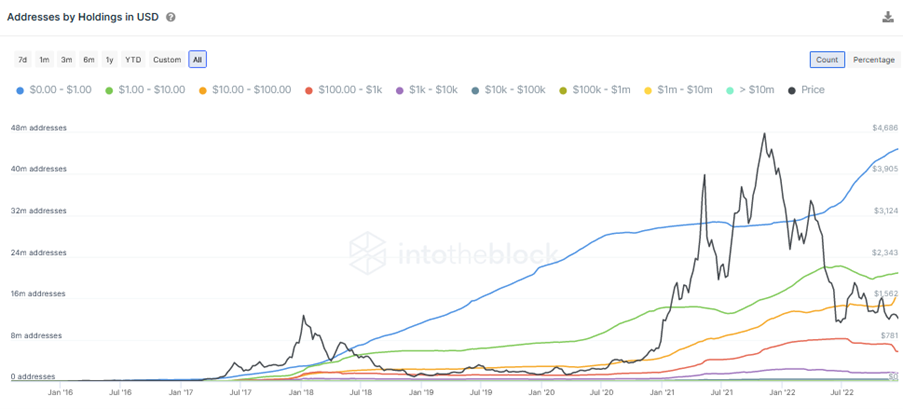
Addresses by Holdings in USD (Ownership)
We have also added a variation on addresses by holdings that shows the data in USD values. This indicator shows the number of addresses holding the selected dollar range. This can be displayed in terms of the aggregate count of addresses or the percentage they make out of the total.
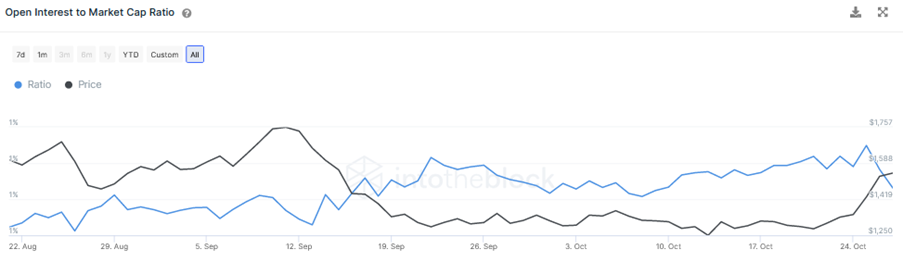
Open Interest to Market Cap Ratio (Derivatives)
The final indicator that we’re introducing is the Open Interest to Market Cap Ratio. This indicator is specifically for derivatives analysis and shows the percentage that derivatives (both perpetual swaps’ and futures’) open interest makes up of the asset’s market cap.
We’re very excited to bring all these new features to the platform before the end of the year. 2023 has a lot of interesting things in store as well, so be sure to follow us here for the latest updates. Sign up for a free trial and click here to try out all the improved cryptocurrency analytics
New indicators and metrics available on IntoTheBlock Analytics was originally published in IntoTheBlock on Medium, where people are continuing the conversation by highlighting and responding to this story.
Publication date
Disclaimer
The views and opinions expressed in this article are solely those of the authors and do not reflect the views of Bitcoin Insider. Every investment and trading move involves risk - this is especially true for cryptocurrencies given their volatility. We strongly advise our readers to conduct their own research when making a decision.