Latest news about Bitcoin and all cryptocurrencies. Your daily crypto news habit.
Litecoin price extended its increase above the $90 zone against the US Dollar. LTC is rising and might attempt a fresh rally above the $100 resistance.
- Litecoin started a fresh increase above the $90 zone against the US Dollar.
- The price is now trading above $90 and the 100 simple moving average (4-hours).
- There is a key bullish trend line forming with support near $89.50 on the 4-hours chart of the LTC/USD pair (data feed from Kraken).
- The price could start another rally if there is a clear move above the $100 resistance.
Litecoin Price Outperforms Bitcoin
This past week, litecoin price formed a support base above the $85 level against the US Dollar. LTC price started a steady increase above the $90 resistance zone, outperforming bitcoin and ethereum.
The bulls were able to push the price above the $95 resistance. A new yearly high was formed near $97.72 and the price is now consolidating gains. It is trading near the 23.6% Fib retracement level of the recent increase from the $86.98 swing low to $97.72 high.
Litecoin price is now trading above $90 and the 100 simple moving average (4-hours). There is also a key bullish trend line forming with support near $89.50 on the 4-hours chart of the LTC/USD pair.
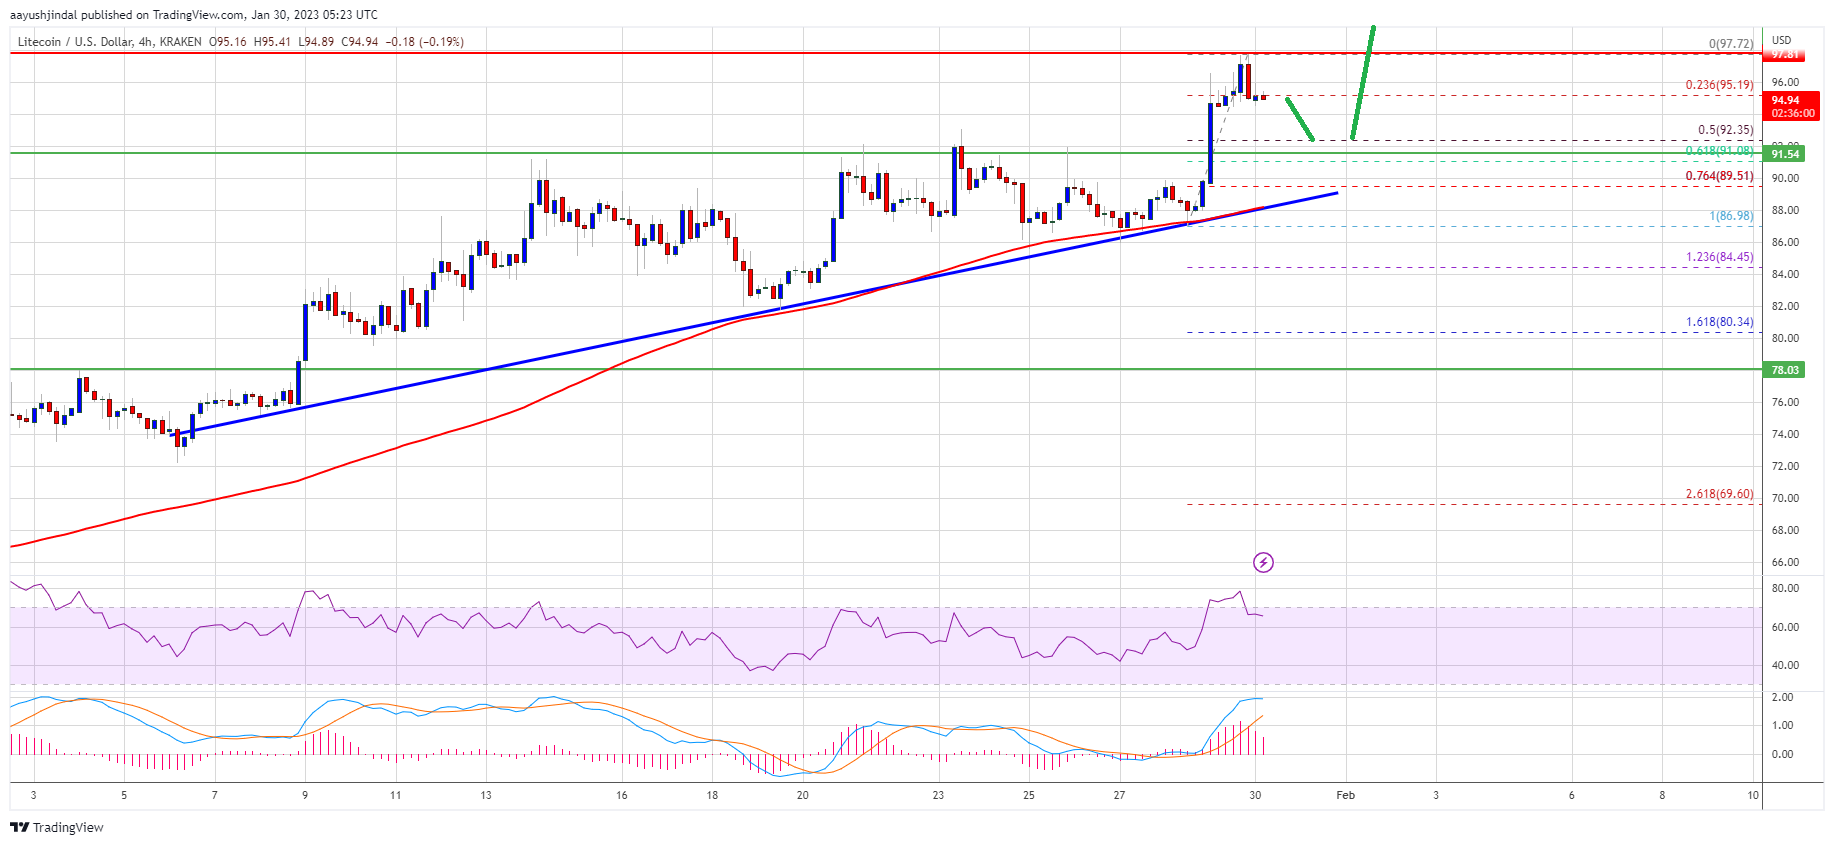
Source: LTCUSD on TradingView.com
On the upside, an immediate resistance is near the $97.75 level. The next major resistance is near the $100 level. If there is a clear break above the $100 resistance, the price could start a strong increase. In the stated case, the price is likely to continue higher towards the $108 and $115 levels. Any more gains might send ltc price towards the $120 resistance zone.
Dips Limited in LTC?
If Litecoin price fails to clear the $100 resistance level, there could be a downside correction. An initial support on the downside is near the $92.50 level.
The first major support is forming near the $90 level or the 76.4% Fib retracement level of the recent increase from the $86.98 swing low to $97.72 high or the trend line. Any further losses may perhaps send the price towards the $85 support.
Technical indicators:
4-hours MACD – The MACD is slowly losing pace in the bullish zone.
4-hours RSI (Relative Strength Index) – The RSI for LTC/USD is above the 50 level.
Major Support Levels – $92.50 followed by $90.00.
Major Resistance Levels – $97.75 and $100.00.
Publication date
Disclaimer
The views and opinions expressed in this article are solely those of the authors and do not reflect the views of Bitcoin Insider. Every investment and trading move involves risk - this is especially true for cryptocurrencies given their volatility. We strongly advise our readers to conduct their own research when making a decision.