Latest news about Bitcoin and all cryptocurrencies. Your daily crypto news habit.
We deployed an Affinity Propagation algorithm to find three distinct clusters of crypto assets, at the top end of the market capitalization table, with similar movements.
Introduction
A few months ago Radicle’s Crypto team began working on a Crypto Index, not as an investment vehicle, but rather for the purpose of having a clear and unbiased benchmark while evaluating new decentralized projects in the crypto economy. This paper discusses some preliminary statistical work that helped us better understand coin movements. In short, we deployed machine learning to settle an internal debate–are cryptocurrencies independent assets with unique movements based on their value proposition, or are they all entirely correlated with Bitcoin’s volatile news cycle?
Why does this matter? If every token simply follows Bitcoin’s movements, then an index is a useless mechanic for assessing performance.
Current tools and best practices are not robust enough to answer the question. At one end of the spectrum you’ll find time series charts with arrows meant to convey some indisputable truth about the world, and at the other, correlation matrices which provide a good general idea of the degree to which crypto assets move in tandem for some period of time, but not enough granular context for a decisive conclusion.
Luckily, the setup to this problem seems almost like a standard unsupervised clustering problem–we have some unlabeled data that we want to organize into groups by similarity. I say almost because, well, if you’re a data scientist, you should notice three distinctions from a vanilla clustering task: (1) Time series data, (2) market capitalizations in the crypto economy are power law distributed, and (3) we do not want to specify the number of clusters returned in advance, like with k-means clustering, because that would defeat the entire purpose of this exercise.
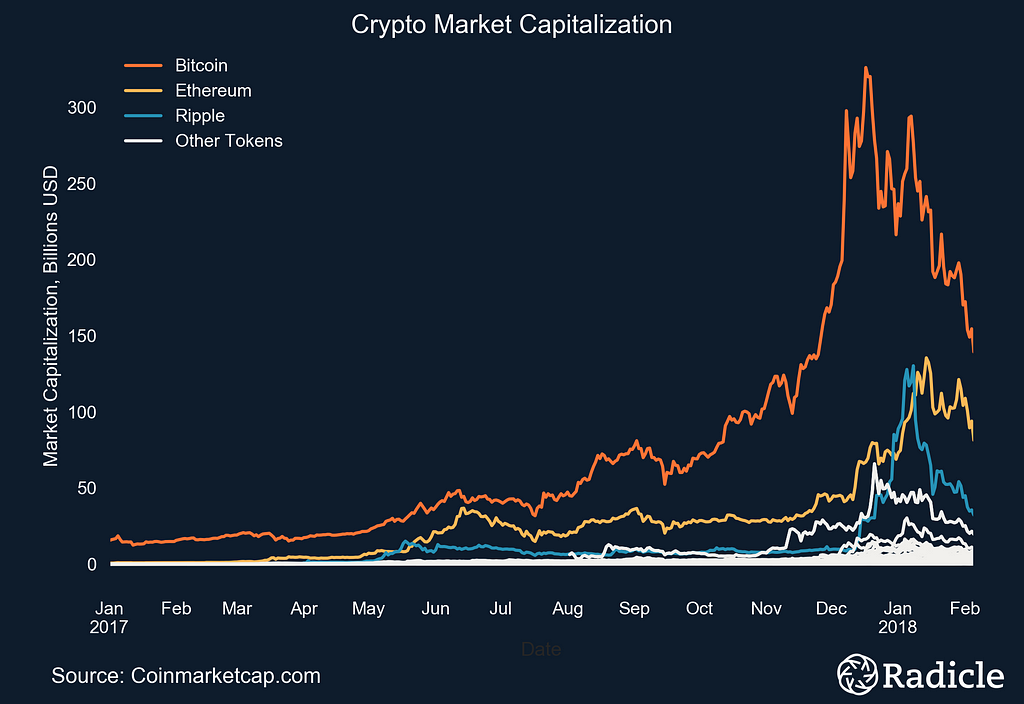
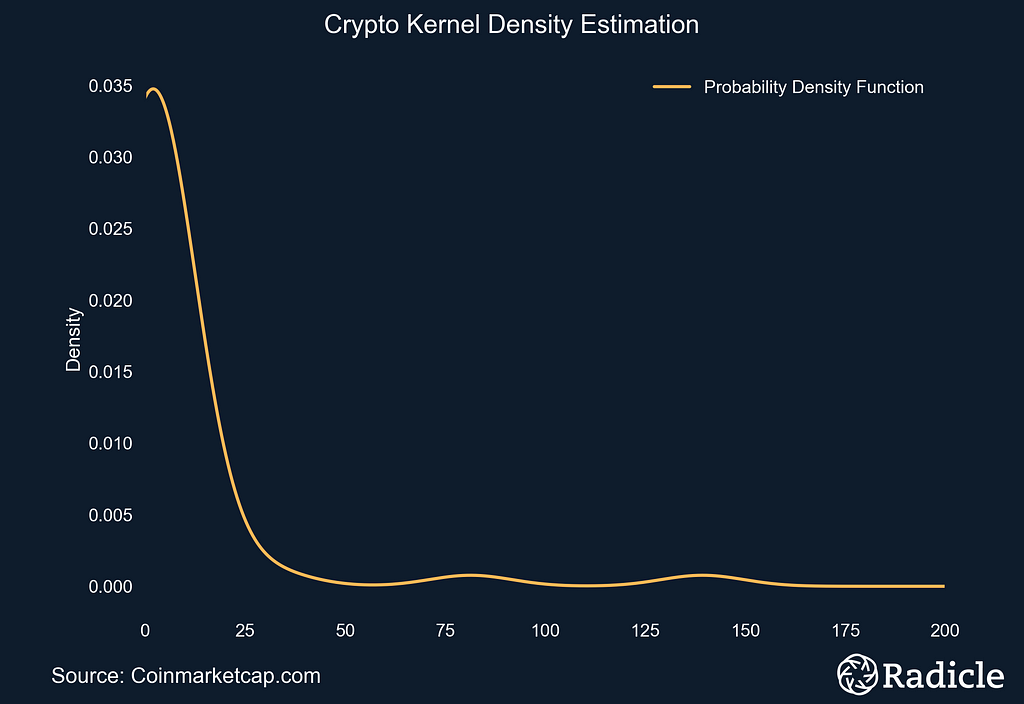 (Left) Time series plot of crypto market capitalizations since January, 2017. (Right) Estimated probability density function of crypto market caps using KDE.
With the problem well defined, we deployed an Affinity Propagation algorithm to find three distinct clusters of crypto assets, at the top end of the market capitalization table, with similar movements. The rest of this paper discusses the theoretical and practical rationale for our approach, details the results, and wraps up with some brief concluding remarks.
Before continuing it must be stressed, as always, that statistical methods, no matter how exhaustive, will only ever provide a probabilistic view of the world. They do not declare causal relationships nor absolute truth. Still, this gave us plenty to think about. Hopefully you’ll agree.Why Affinity Propagation?
From the beginning we identified some essential desiderata that the algorithm needed to maintain in order to produce scientifically diligent results. Overall, we found that Affinity Propagation not only met all our desiderata, but is also just generally a very powerful algorithm in theory and in practice.
Affinity Propagation, published in Science by Frey and Dueck, takes as input measures of similarity between data points and exchanges real-valued messages between data points until high-quality clusters naturally emerge. While exchanging messages the algorithm identifies exemplars, which are observations that do a good job of describing a cluster. You can basically think of exemplars as centroids, with the exception that they are not the average value of all objects in each group, but rather a real observed data point that describes its closest neighbors. For our purposes, that implies that our exemplars will be some real crypto asset. That said, after running the algorithm we still computed centroid “trend” lines and show them in the plots below to facilitate interpretation.
With the exemplars identified, the algorithm itself teases out how many natural clusters exist in the data. The only hyperparameter that really needs to be carefully tuned, according to the creators, is the damping factor, which is set to avoid numerical oscillations as messages are being passed between data points. The creators recommend setting the damping factor to 0.9. In our task, values between 0.5 and 0.83 resulted in the identification of four clusters. Increasing it above 0.83 resulted in three clusters. More specifically, setting a higher damping factor combined clusters three and four from the lower damping set, with the first two clusters being completely unchanged. In the end, we set the damping factor above 0.83 because the results where marginally more intuitive.
We considered a few other algorithms for the task, however none fulfilled one or more of our desiderata. We knew that identifying cryptocurrencies that are very similar for only a few months out of the year, but completely dissimilar the rest of the year, would be undesirable. Equally important, we wanted to measure, and therefore isolate, as much as possible, the daily impact of the news cycle on market capitalizations; ignoring any delayed effects. Therefore, similarity needed to be evaluated exclusively at each date index, but across the entire array. Dynamic Time Warping, which is a popular approach for measuring the similarity of time series data with varying lengths and with out-of-phase similarities would not work–exactly because it attempts to find out-of-phase similarities. We have the luxury of a problem where the data is intentionally in-phase and of the same length. And as described above, k-means clustering and its many variants would not work because we don’t want to tell the robot how many clusters there should be.
For the distance measure, it was determined that standard negative Euclidean distance would do the job well if we could standardize the power law distributed data. And to do just that, each vector was first log transformed and then standardized by subtracting its mean and dividing by its standard deviation; producing a clean and comparable dataset.
Conveniently, all of the above implied that sci-kit learn’s Affinity Propagation implementation would do just fine, for our purposes. We pulled historical data for the top 50 crypto assets, in terms of market capitalization, from Coinmarketcap.com in early February. Of those 50, only 26 have been around sufficiently long enough for effective clustering (at least a year).
Results
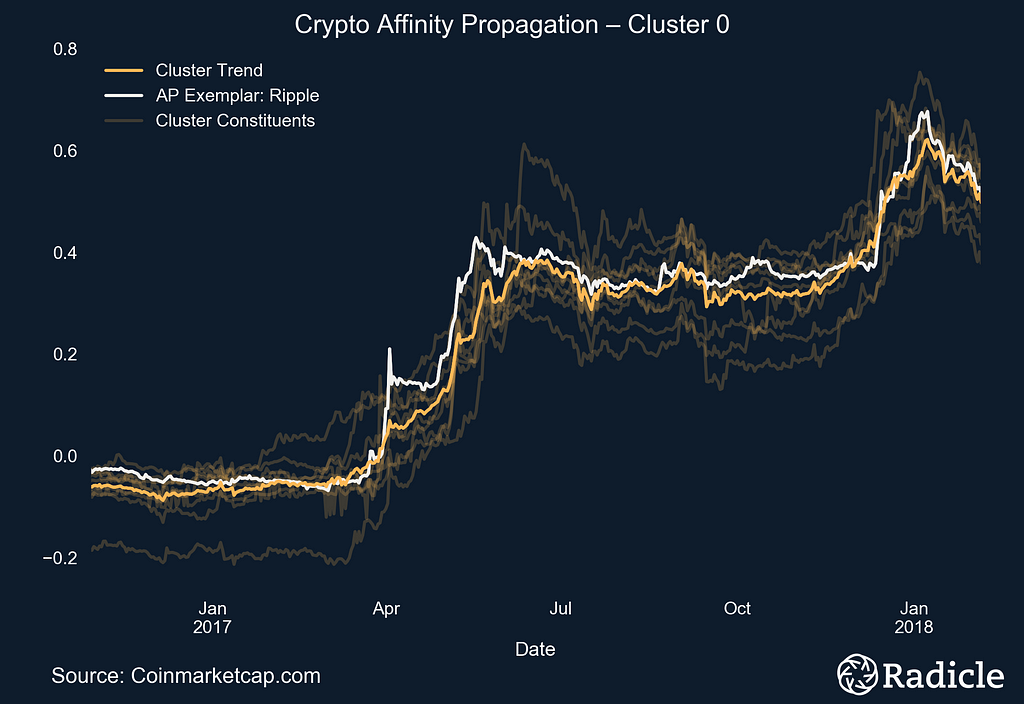
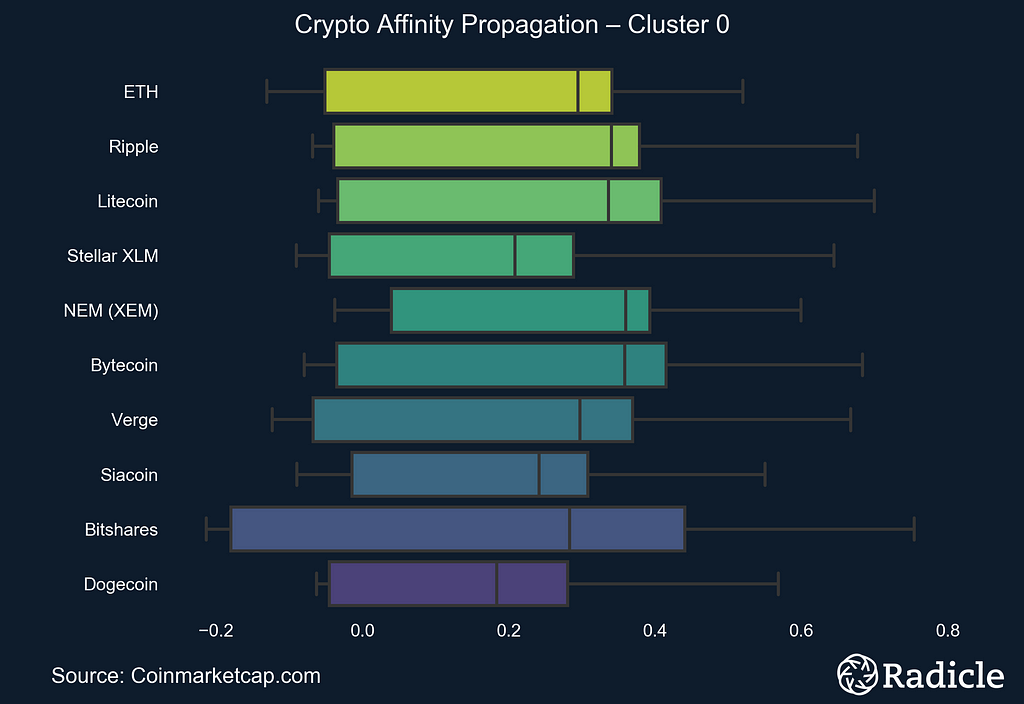
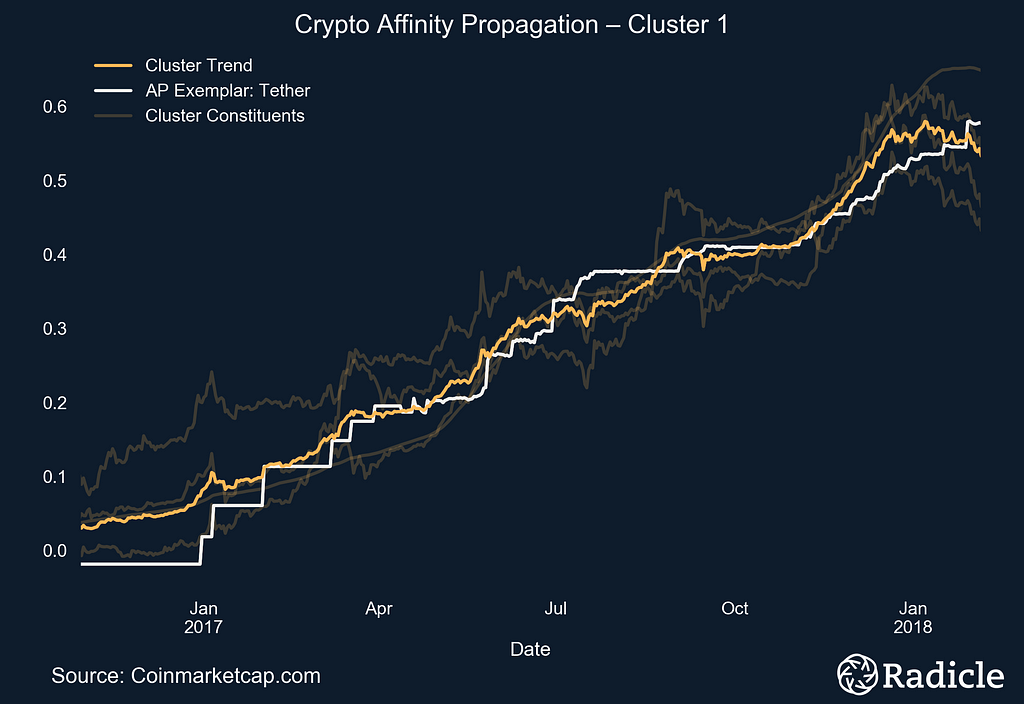
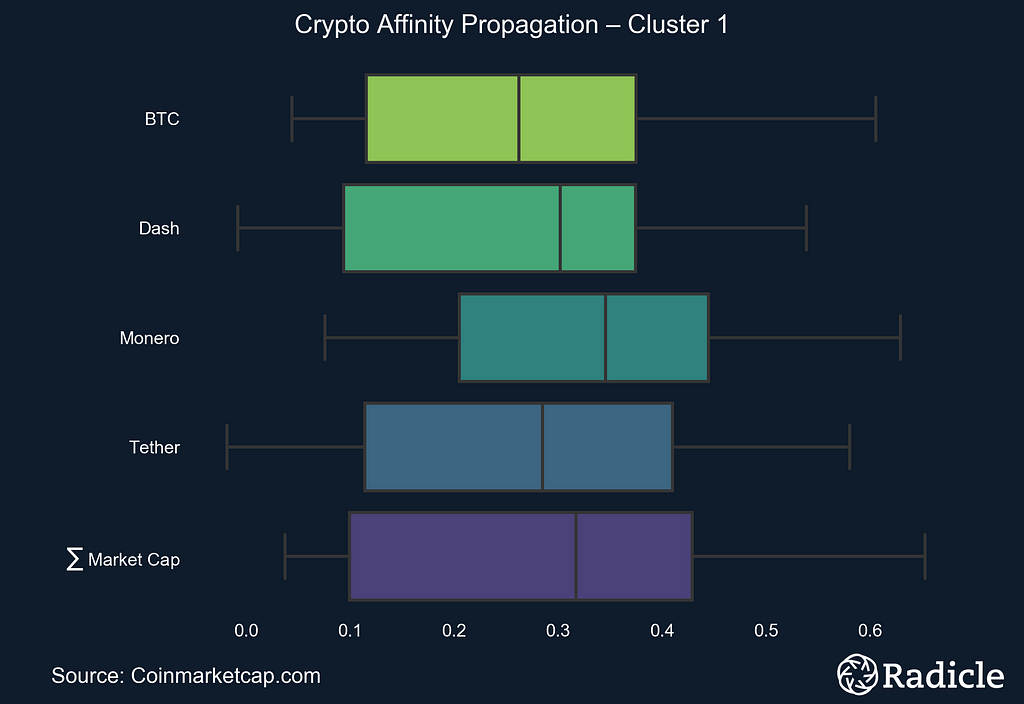
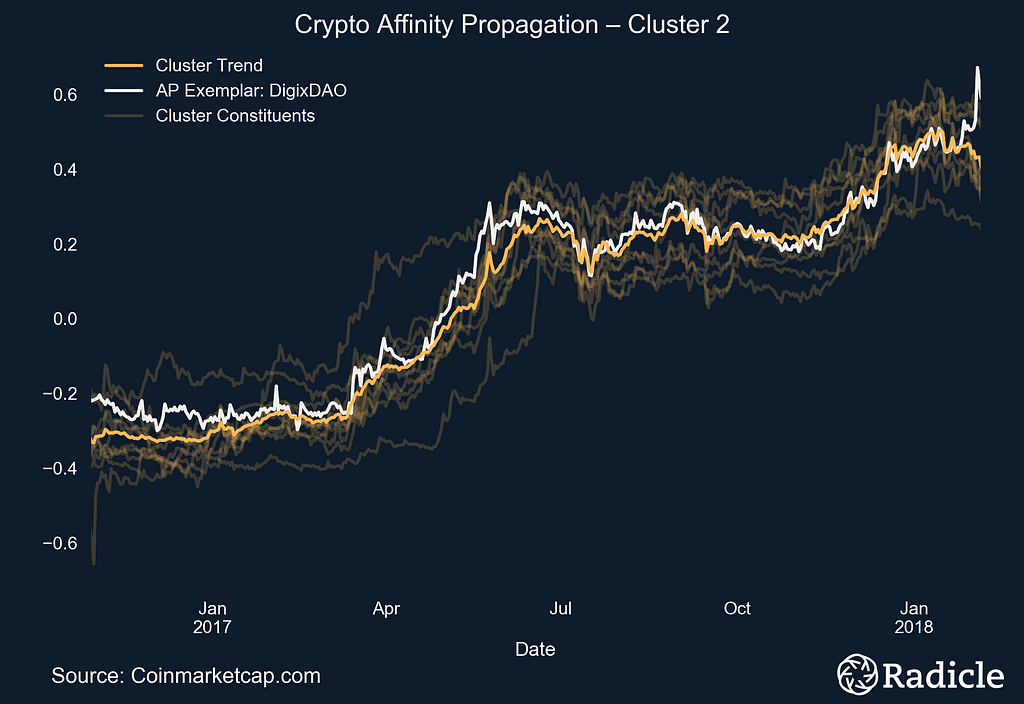
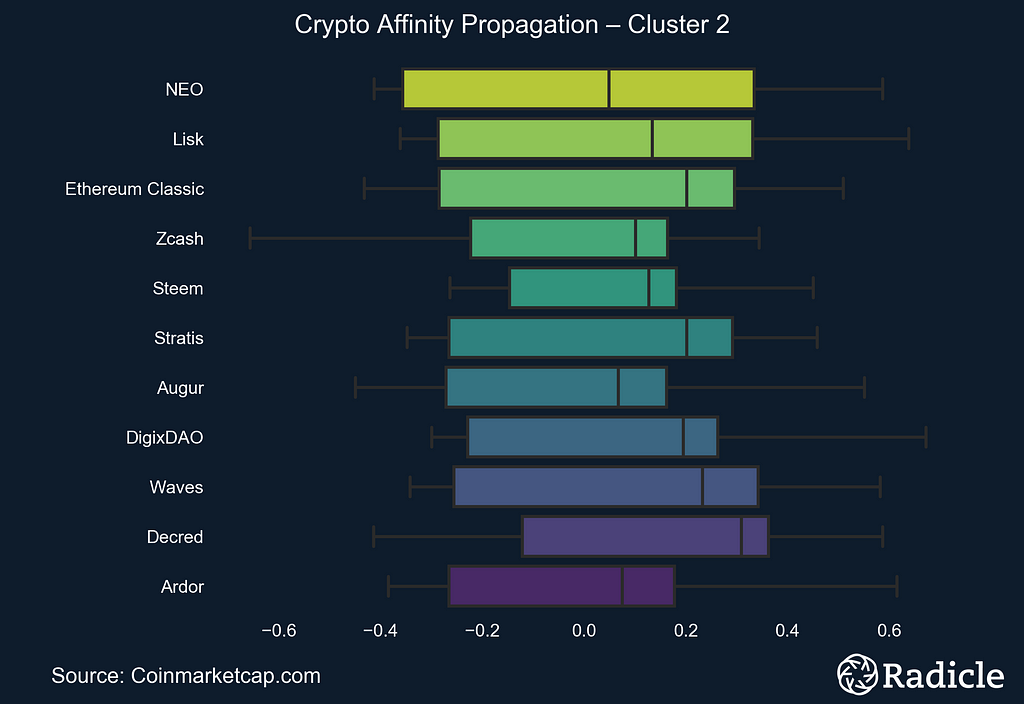
The side-by-side plots below correspond to each of the three identified clusters. On the left we present the clusters in time series form, with the exemplar in white and the centroid line of all objects in the cluster in bright yellow. The other constituents in the space are shown in faint yellow. On the right we present the corresponding box plot for each cluster, which effectively provides a look at the same data from a different perspective. The Affinity Propagation algorithm found three exemplars: Ripple, Tether, and DigixDAO. The first cluster consists of largely established crypto assets.
 Note: The clusters start at index zero.
Notable assets in this cluster are Ethereum and Ripple, the second and third largest assets by market capitalization, respectively. Others in the cluster are platforms (BitShares), payment networks (Stellar), currencies (Litecoin, Nem, Bytecoin, Verge, Dogecoin), and decentralized apps (Siacoin). All of these assets were created and launched on or before 2015, long before crypto mania took hold.
The next cluster contains Bitcoin, Tether, Dash, Monero, and the sum total market capitalization for the entire sample. The assets in this cluster are all currencies, with Dash and Monero being anonymous coins focused on privacy. This is an interesting result because it has been argued that Tether is propping up Bitcoin, and therefore the entire market, with tokens claimed to be backed 1-to-1 with US dollars. Tether was subpoenaed by the US Commodity Futures Trading Commission in early December, 2017.
As far as cluster three, well, we’re not really sure what to make of it. While we expected to perhaps see some divergence between Bitcoin and Ethereum, this cluster suggests that there’s more heterogeneity in the crypto space than we anticipated. Our Crypto analysts noticed that these trend towards being dApp platforms, and that they seem to be slightly newer assets. My takeaway is, as usual, that the real world is significantly more complicated than we generally assume, and we would likely find more clusters like this one if we increase our sample of crypto assets.
 Concluding Remarks
There are a number of notable insights that can be inferred from the plots above. The first of which is obvious, we found more than one cluster, which implies that no, crypto assets do not exclusively follow Bitcoin’s volatile news cycle. That said, there do seem to exist natural clusters of coins that move in tandem, and we expect there to be more as the crypto sample increases.
Overall, this study helped us come to the conclusion that a fundamentals framework for assessing crypto assets is an appropriate methodological approach. When evaluating crypto platforms, we look at the problem they’re trying to solve, the size of the opportunity they’re competing for, whether or not their competitive context is ripe for decentralization, and much more. All of our work is available at rad.report/crypto.
Our very own Harry Simon, Crypto Lead at Radicle, will be at the LendIt FinTech conference in San Francisco this week, presenting on the Crypto Research & Valuation panel. If you’re at the conference, or in the area, you can reach out to him via Twitter if you’d like to learn more. He’ll be happy to discuss our Crypto work.
If you like this work, please clap and share so others can find it. Subscribe below, connect on LinkedIn, or follow on Twitter if you’d like to be notified when future research is released.
For further reading, check out the Capital Concentration Index™(a measure of startup competition), how much runway you should target between financing rounds, and the Investor Cluster Score™ (a measure of the signal produced by a startup’s capitalization table).
Disclosure: Team members at Radicle hold positions in one or more cryptocurrencies. Those positions did not influence this work in any way. Our aim is to provide unbiased, objective analysis. And finally, this document does not constitute financial advice. Cryptocurrencies are high risk speculative investments. Invest at your own risk.
Clustering Cryptocurrencies with Affinity Propagation was originally published in Towards Data Science on Medium, where people are continuing the conversation by highlighting and responding to this story.
Publication date
Disclaimer
The views and opinions expressed in this article are solely those of the authors and do not reflect the views of Bitcoin Insider. Every investment and trading move involves risk - this is especially true for cryptocurrencies given their volatility. We strongly advise our readers to conduct their own research when making a decision.