Latest news about Bitcoin and all cryptocurrencies. Your daily crypto news habit.
 Lets start this off with the following disclaimer:***This is not financial advice and I am not a licensed adviser. This is intended as a look into my personal strategy and nothing further. Utilize any information from this story at your own risk and perform your own research.***
Now that that’s out of the way…
Welcome! As folks are starting to get more and more excited about the potential of an alt season, I wanted to provide some insight to how I personally look for trades and what indicators I like.
A little background about my personal strategy: I like to find longer term trades with what I consider lower risk. I look for these setups and gather many bags. Once one of these bags take off, I slowly exit my position and place the funds into ones that have not taken off yet.
For starters, while you may have seen this chart/graph posted 100 times, I do think it has a lot of value.
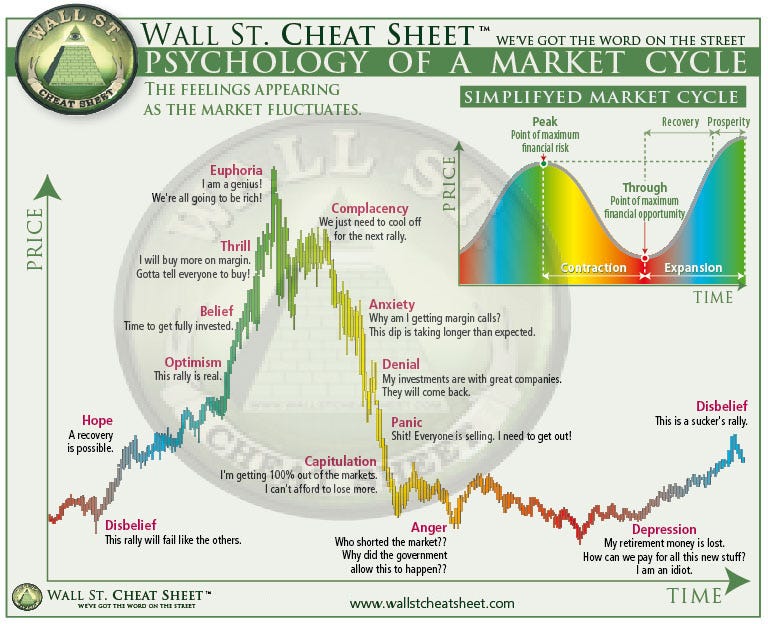 Wall St. Cheat Sheet
Take a look at $SC (SiaCoin). When I created this chart, you can see how it lines up with the above graph.
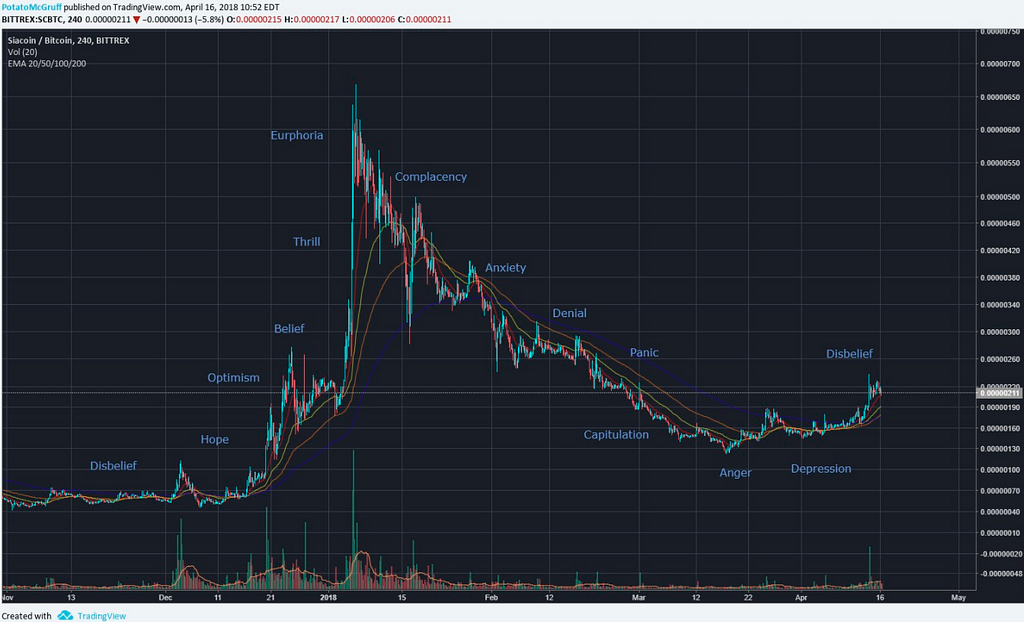
These are the setups I’m looking for.
As of writing (4/18/18) they are all over the market. I always use the 4HR or higher time scale when searching for these.
One of my favorite indicators to pair with this is the EMA or Exponetial Moving Average.
What is the EMA you may ask? More weight is given to the latest data compared to the SMA (Simple moving average). You can utilize EMA to determine the strength of the market. I have a simple custom script on trading view you can use to find my EMA template. Search trading view for “EMA 20” and you’ll see one authored by yours truly.
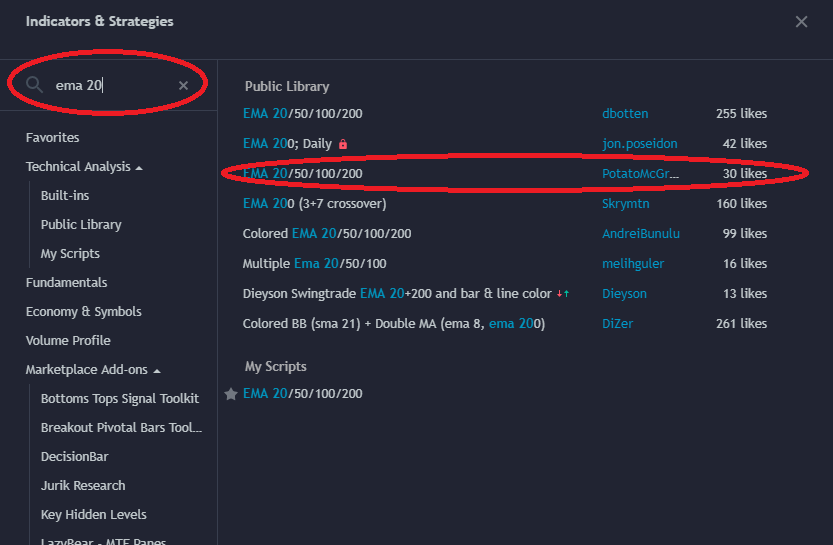 And it only counts as one indicator! If you use it, give it a like!
This utilizes the 20 day, 50 day, 100 day, and 200 day EMA. So now you’re saying “Ok cool, I have these lines on my chart now. What do I do with them?” You’re now looking at the price movement averaged over the past 20, 50, 100, and 200 days. We will see a trend shift much faster on the 20 day average than you will on the 50 and higher. So, when the 20 starts to angle up and crosses over the 50, the 100, and 200, we’re seeing a large shift in the trend.
This is even more applicable for the higher timescales when they cross. One of the most popular bullish market signals is the 50 crossing over the 200, known as a “Golden Cross”
This also works in reverse if you see the 50 crossing down over the 200, known as a “Death Cross”
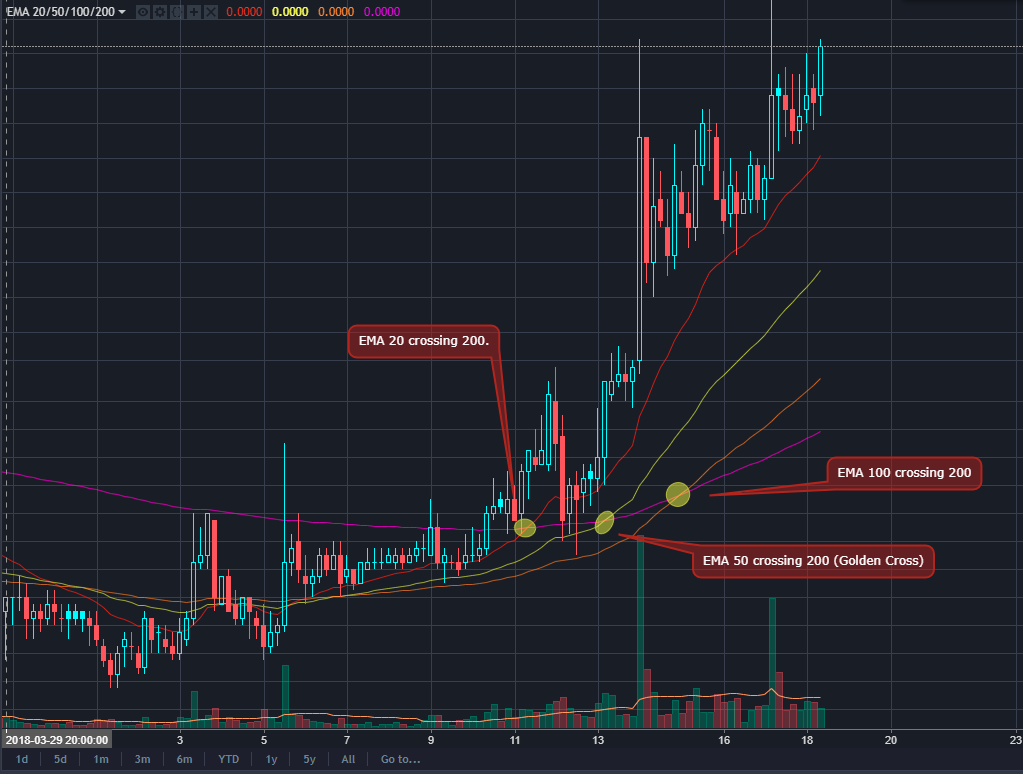 Example of EMAs crossing
What else is interesting, is often we will see the price of a coin respect EMAs as supports or resistances. As shown above, you can see it is following the 20 EMA as a support.
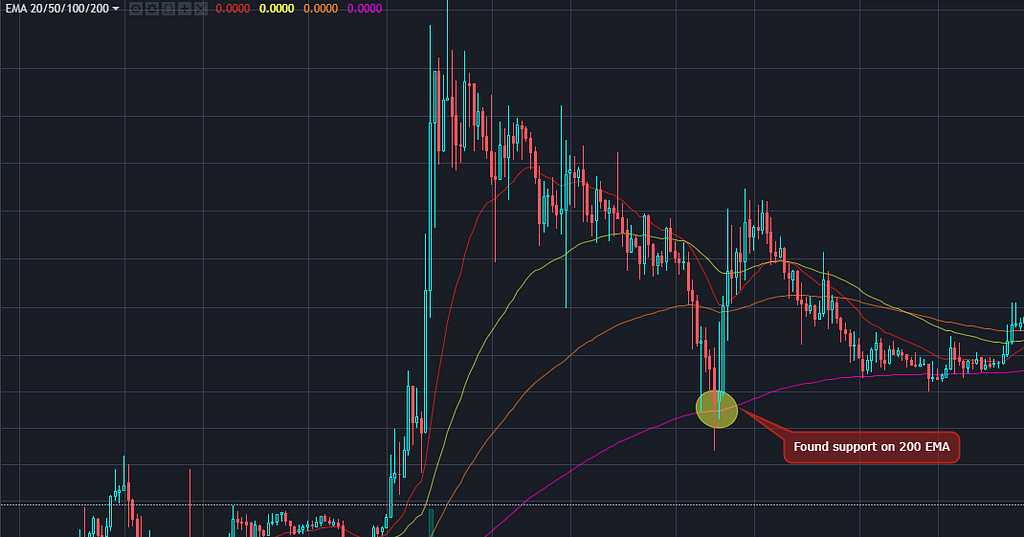 Another example where a coin found support on the 200 EMA when dropping.
Now, just like any indicator, this isn’t a perfect science. By its nature, the EMA is a lagging indicator.
Directly from Investopedia on Lagging Indicators: “ Since these indicators lag the price of the asset, a significant move in the market generally occurs before the indicator can provide a signal.” Meaning, the market is going to move before you see it on the EMAs. This is why it’s much more applicable to large trend trading rather than day trading.
This is why I utilize the signal for larger swing trades or shifts in the market and not for day trading.
So, in conclusion, I like to find setups similar to the one I mentioned before. Where we’ve seen a market cycle line up with the Wallstreet chart and we’re showing some bullish EMA crossovers. As a trader who doesn’t have time to baby-sit charts, this allows me to take position, set alarms at significant resistance/support lines, and take care of my day to day life.
I hope you’ve gained something out of this and you’re welcome to follow me on Twitter @PotatoMcGruff or to come chat with me and other traders at Crypto Mountain, our free Discord group.
I also contribute to the Bitcoin Masons which can be found at that hyperlink.
Happy Trading and good luck out there!

The McGruff Market Cycle Strategy was originally published in Hacker Noon on Medium, where people are continuing the conversation by highlighting and responding to this story.
Publication date
Disclaimer
The views and opinions expressed in this article are solely those of the authors and do not reflect the views of Bitcoin Insider. Every investment and trading move involves risk - this is especially true for cryptocurrencies given their volatility. We strongly advise our readers to conduct their own research when making a decision.