Latest news about Bitcoin and all cryptocurrencies. Your daily crypto news habit.
I am a fan of the Browser Dev Tools, the secret power weapon 🚀 for all us Web Developers.
Without them, we’d look at a web page in despair, trying to figure out why elements don’t align, an image is not loaded 🤦, and we’d be clueless at other much more complex scenarios.
I recently switched to using Firefox for my daily browsing, and I realized that I knew very little about the Firefox Dev Tools. Also, I realized how much they have improved over the last few years, and I thought — they deserve a lot more buzz 😄! So here is a post that shows some of the things you can do with them, with some nice GIFs to make it easier to have a quick grasp at each topic.
Screenshot tricks
Take a screenshot of the whole page
Enable the screenshot button in the settings, and press it to create an image that contains the page screenshot. It will be saved in the default downloads folder, using the current page width.
 Take a screenshot of a single node
Select an element in the Elements Inspector and right click it, then choose Screenshot Node:
Remove a class from an element
Sometimes an element has multiple classes and you can’t immediately find out which class introduces a particular styling attribute. By selecting an element and clicking the .cls button at the top-right of the Rules panel, you can see a list of all the classes and you can easily disable/re-enable them.
From there, you can also add a new class to that element:
Drag-and-drop in the Elements panel
In the Elements panel, you can drag and drop any HTML element and change its position across the page
Reference the currently selected element in the Console
Select a node in the Elements panel, and type $0 in the console to reference it.
 Selectors API shortcuts
One totally cool feature of the Firefox Dev Tools Console is the shortcuts for the Selectors API:
- $() is a shortcut for document.querySelector()
- $$() is a shortcut for document.querySelectorAll()
Use the value of the last operation in the Console
Use $_ to reference the return value of the previous operation executed in the Console
 Reference any element from the Inspector, in the Console
Right click any element and select Use in Console. It will be assigned to a temporary variable.

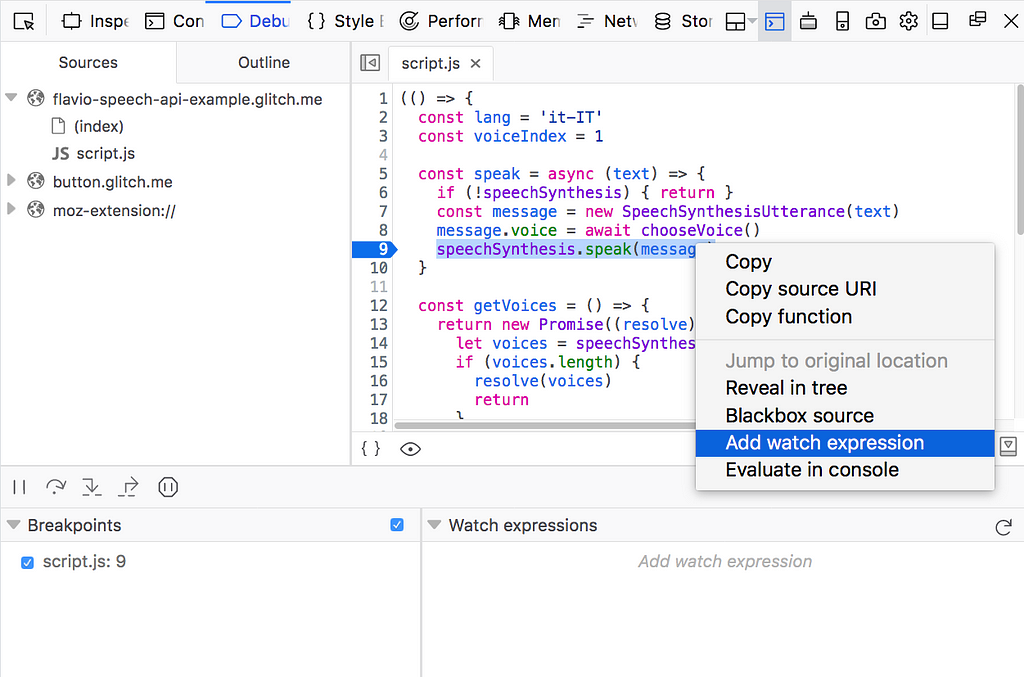
Debugging JavaScript
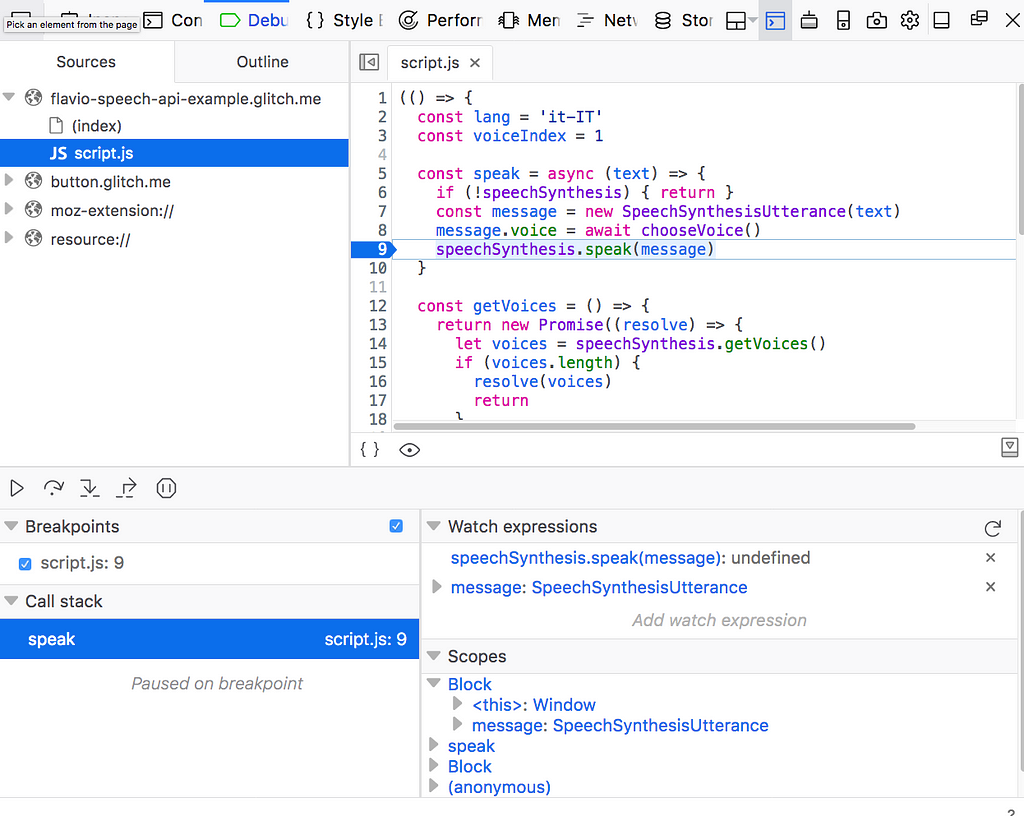
You can set breakpoints on your JavaScript source files from the Debugger panel, and you can set any expression in the JS file to be watched:
Reloading the page, the breakpoints and watch expression settings are kept intact, and the script will halt at the desired position:
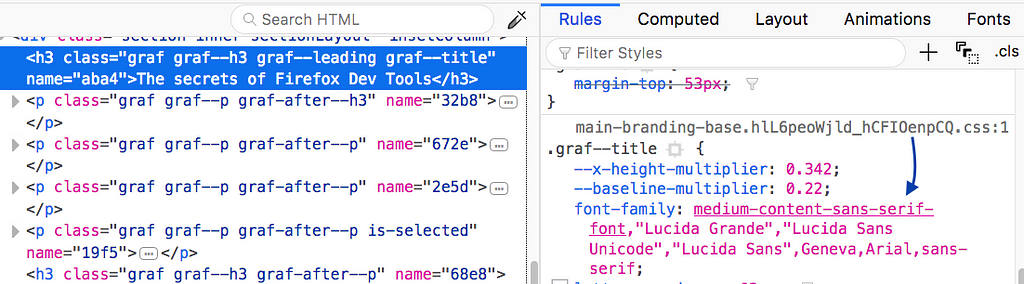
Find out which font is actually used
font-family in CSS allows you to set a list of fonts to use, in case the first one is not found it falls back to the second and so on. But how do you know which font is actually applied when you look at the page? It’s the one underlined:
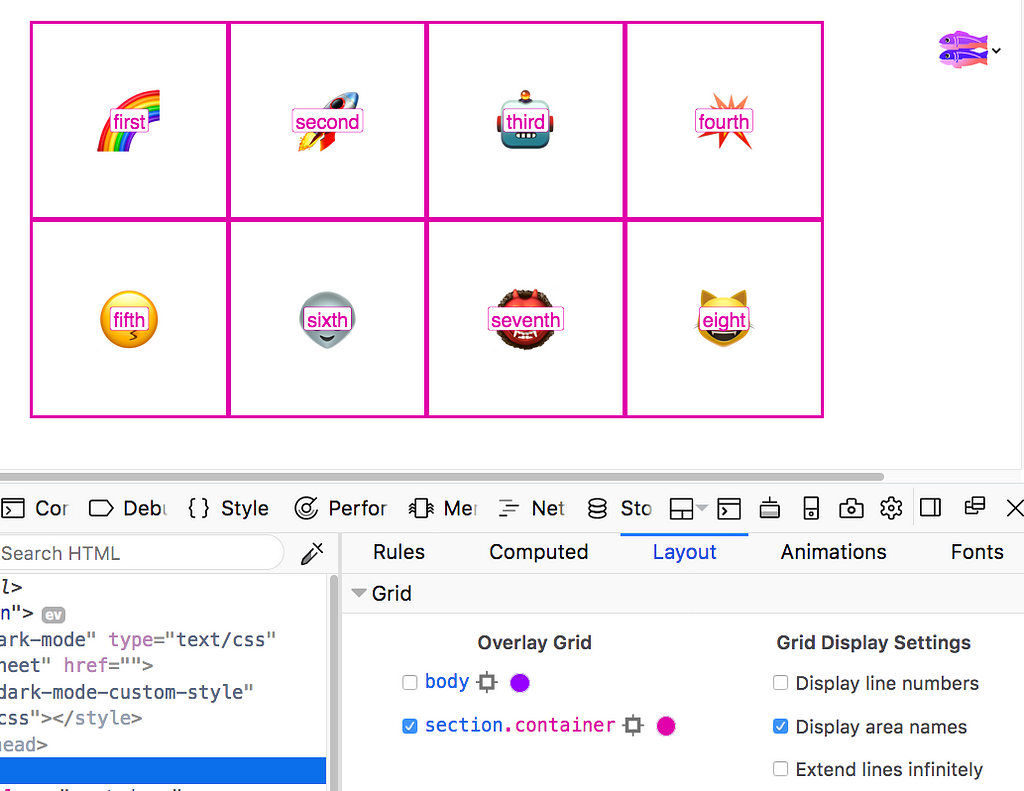
Inspect CSS Grid
CSS Grid is a recent new and amazing CSS feature.
Firefox Dev Tools have a great inspector that helps us so much when using grids:
If you use grid template areas, you can display them using the “Display area names” checkbox:
Thanks for reading through this article! I hope you enjoyed it. I publish one free tutorial every day on my site flaviocopes.com, check it out if you want to learn more about frontend development 😀
10 Firefox Dev Tools tricks that will blow your mind was originally published in Hacker Noon on Medium, where people are continuing the conversation by highlighting and responding to this story.
Publication date
Disclaimer
The views and opinions expressed in this article are solely those of the authors and do not reflect the views of Bitcoin Insider. Every investment and trading move involves risk - this is especially true for cryptocurrencies given their volatility. We strongly advise our readers to conduct their own research when making a decision.