Latest news about Bitcoin and all cryptocurrencies. Your daily crypto news habit.
Creating interactive infographics with plain Javascript (Part-one) Interactive infographics with plain JavascriptIntroduction
Interactive infographics with plain JavascriptIntroduction
Today’s browsers let us connect information in ways never seen before. Infographics is one such area. As a pictogram, it is an excellent visualisation tool. As an interactive webpage, it gets even better with just a little bit of coding.
Many open-source libraries render fantastic infographics. Our favourites are D3, and vis.js. However, there are other times when we needed features that aren’t available from public libraries. That’s where the fun begins.
Objective
Let’s build an interactive infographic with plain Javascript.
Case Study
The Google Cloud Platform (GCP) is like a candy store to a web developer. Its product categories are more than fingers can count and each interconnects in different ways to solve complex problems.
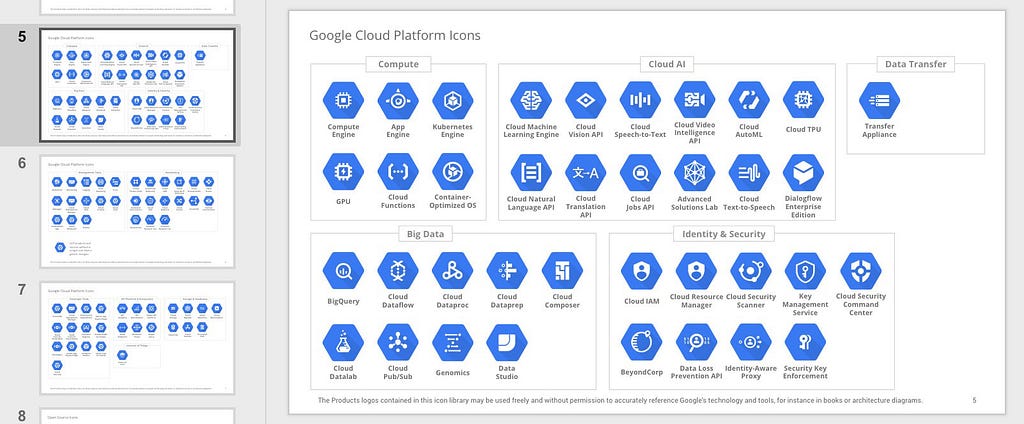 The GCP “Org chart”. Official
Publication date
Disclaimer
The views and opinions expressed in this article are solely those of the authors and do not reflect the views of Bitcoin Insider. Every investment and trading move involves risk - this is especially true for cryptocurrencies given their volatility. We strongly advise our readers to conduct their own research when making a decision.