Latest news about Bitcoin and all cryptocurrencies. Your daily crypto news habit.
Let me begin by saying, these are merely my own studies and observations. My studies are not financial advice and only meant to be used as guidance and for leisure.

KEY PRICE — $6,800
PRICE PREDICTIONS
The month of July played out almost perfectly to the predictions.
Bitcoin Price Analysis — July Month Outlook
By end of August:
If Bulls are strong — $8,500 to $9,800
If Bears are strong — $5,900 to $5,000
As with my July article, I will try and present from both bullish and bearish perspective in an effort to remain as neutral as possible.
Bullish = Bias towards price appreciation or going upBearish = Bias towards price depreciation or going down— — — — — — — — — — — — — — — — — — — — — — — — — — — — — — —
Bitcoin Analysis
As of 5th August 2018
 As of 5th August 2018
Prior pattern before breakout: Inverse Head & ShouldersKey Supports: $6,800Key Resistance: $7,700, $8,200
Head and Shoulders Bottom (Reversal) [ChartSchool]
BULLISH PERSPECTIVE

Inverse (or reverse) Head and Shoulders pattern is a powerful reversal pattern formed after a downtrend. Bitcoin has been on a downtrend since the beginning of the year and forming this inverse H&S close to the strong horizontal support of $6,000 can be taken as a huge bullish sign.
The key support point would be $6,800 for this inverse H&S to successfully play out. As with all major patterns, a breakout retest is highly recommended to continue the bullish sentiment. However, the story will be very different if Bitcoin fails to find support at $6,800.
Key resistances can be found at around $7,700 which coincides with the daily 200MA. If the price can close ABOVE $7,700, it can be taken as a massive bullish sign that we are out of the downtrend.
The Relative Strength Index (RSI) is potentially forming a Hidden Bullish Divergence. It has not formed just yet so I am basing this on speculation alone. IF $6,800 manage to hold, the hidden bullish divergence will form and bulls will take that as a strong signal to push the price up higher.
— — — — — — — — — — — — — — — — — — — — — — — — — — — — — — —
Dominant Pattern: Elliot Wave TheoryKey Supports: $6,800Key Resistance: $8,500, $10,000
Elliott Wave Basics [ChartSchool]
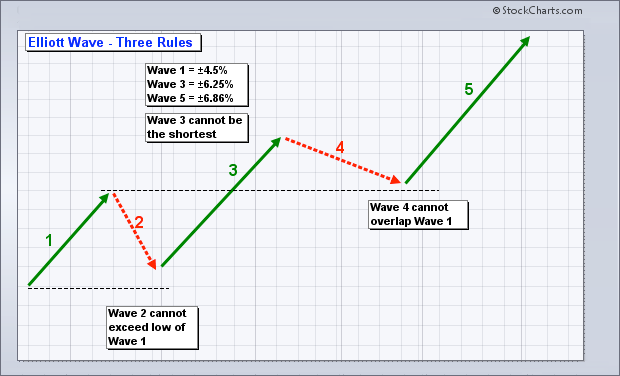
Three Rules of Elliot Wave Theory —
Rule 1: Wave 2 cannot retrace more than 100% of Wave 1Rule 2: Wave 3 can never be the shortest of the three impulse wavesRule 3: Wave 4 can never overlap wave 1.
With Bitcoin, we have successfully adhered to the first and second rule. Now we have to see if Bitcoin drops BELOW $6,800 and it will render this theory useless.
Let’s analyse each of the waves —

✅ WAVE 2 —

Assuming Wave 1 has formed, the lowest wave 2 can go is 61.8% of wave 1 by using the guide above. And here we can see that Wave 2 perfectly fell on the 0.618 fib.
✅ WAVE 3—

Wave 3 cannot be the smallest wave and it checks out right here. Using the guide above, Wave 3 will either be 161.8% or 261.8% of Wave 1. Fibonacci tool showed that we have successfully achieved that. We hit some form of resistance on 161.8% but it continued straight up to 261.8% after a few days.
⚠️ WAVE 4—
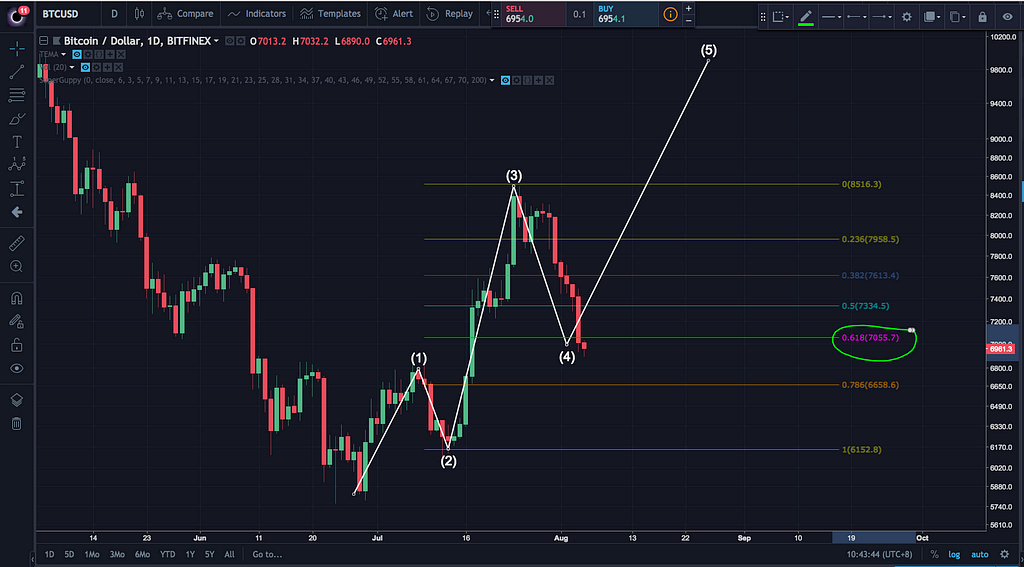
Wave 4 is seen as an enigma in the Elliot Wave’s Theory. There are several schools that will not count wave 4 if it falls below 0.5 fib level. Some schools do count it up to 0.618 fib level. BUT the main rule for Elliot Wave Theory is, Wave 4 cannot go below the top of wave 1. $6,800 is the key price to hold and if we successfully lift off from this price, we can expect Bitcoin hitting new resistance.
⚠️ WAVE 5—

Wave 5 has yet to play out so we are speculating. If Wave 4 successfully bounce above the top of wave 1, we can expect Bitcoin to at least hit $7,700. The highest wave 5 can take us is the next swing high resistance of $10,000. Wave 5 is deemed to be the last impulse wave and normally, it will be the retail investors who would print this wave on the chart.
✅ WAVE 1—
Why do I only start talking about Wave 1 here? Wave 1 is the hardest to spot as it occurs below the radar. With Wave 2 and 3 printed on the charts, we can assume that wave 1 has occurred. Wave 1 represents the early-birds, institutions or traders with info regarding ‘something’. In this case, it was the Bitcoin ETF news.
Correction Waves ABC —
My speculative guess would be, the correction waves for this elliot wave movement shall occur in September so we shall visit them next month.
— — — — — — — — — — — — — — — — — — — — — — — — — — — — — — —
Long Traders are expected to prepare their purchases at $6,800. Let’s hope the bulls are strong.
These analysis are coming from a bull’s perspective.
Let’s take a look at it from a bear’s perspective…
— — — — — — — — — — — — — — — — — — — — — — — — — — — — — — —
BEARISH PERSPECTIVE
As of 5th August 2018
 DAILY CHART — BEARISH CHANNEL
Dominant Pattern: Bearish ChannelKey Supports: $6,800, $5,800, $5,000Key Resistance: $8,500
Price Channel (Continuation) [ChartSchool]
As we are still in the bear market, Bitcoin is forming a clear bearish channel. The run-up we had since end-June is just a correction in the downtrend.
Key prices to take note of: $6,800 being the point where the inverse H&S broke out from will be crucial for the bulls. Breaking down below this price can certainly drag Bitcoin down to $5,800 and eventually $5,000 in September.
Just from the chart above, short traders will target the bottom of the channel. If Bitcoin breaks below $6,800, we can expect a lot of short traders entering, causing Bitcoin to plummet further.
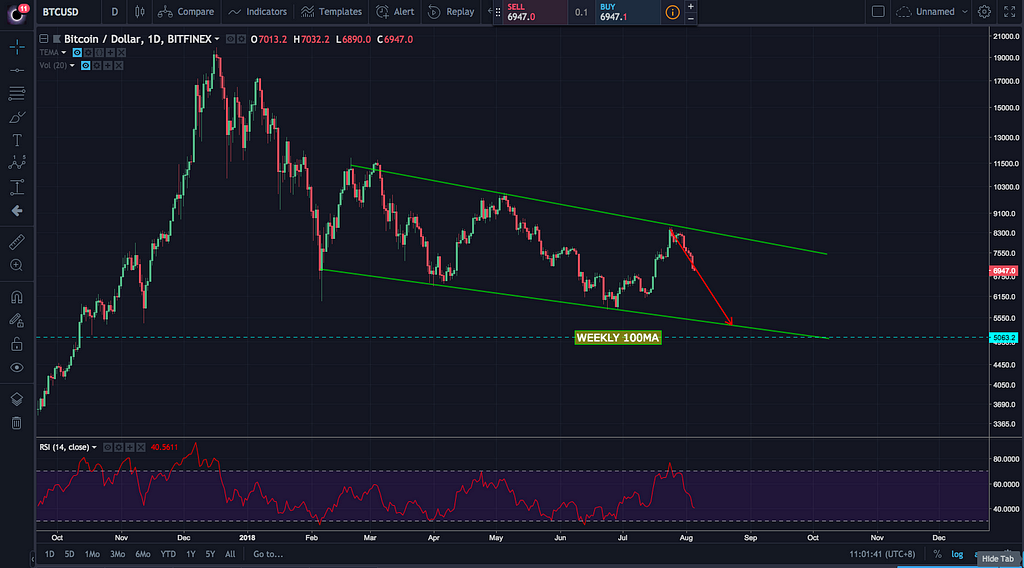
 WEEKLY CHART — MOVING AVERAGES
On the weekly chart, we can clearly see a massive rejection from the Weekly 50MA. A rejection can potentially drag Bitcoin down to 100MA which is at $5,000 as of today.
RSI failed to break (and stay) above 50 which means, sell side is in control.
 DAILY CHART — HIDDEN BEARISH DIVERGENCE
 Hidden Bearish Divergence Example
A huge bearish signal can be seen on the daily RSI. A hidden bearish divergence has formed and it can potentially drag Bitcoin BELOW $6,800
— — — — — — — — — — — — — — — — — — — — — — — — — — — — — — —
Conclusion and Personal Thoughts
PRICE PREDICTIONS (again)
If Bulls are strong — $8,500 to $9,800
If Bears are strong — $5,900 to $5,000
I am bullish biased.
— — — — — — — — — — — — — — — — — — — — — — — — — — — — — — —
Personally, I feel that Bitcoin will bounce off $6,800 and look to complete the Impulse Elliot Wave movement. This will cause Bitcoin to break free from the bearish channel and we can thus find greener pastures.
The decision over the Bitcoin ETF by VanEck holds all the hopes and dreams of investors in the Crypto-space. If approved, we can definitely see Wave 5 play out. If rejected, the bearish scenarios will play out. We will have to wait and see what happens.
Winklevoss Bitcoin ETF was Rejected, But VanEck ETF has a Chance to be Approved | NewsBTC
There are plenty of bullish news popping out everyday but the price is showing otherwise. Claims of manipulation are arising but technical analysis does not lie and we can see why Bitcoin is dropping in price.
- Starbucks' crypto move could help put bitcoin in your retirement account, an investor says
- Despite NYSE's 'Biggest News of the Year' for Bitcoin, Crypto Markets Plummet in a Blink
It is just a matter of time until we will know the outcome on Bitcoin further down the months. As mentioned in the July analysis, the space is moving much faster now and I expect we will see more work done the rest of 2018.
What are your personal predictions for Bitcoin over the month of August?
Let me know your thoughts below! :)
— — — — — — — — — — — — — — — — — — — — — — — — — — — — — — —
Follow me on Medium to receive instant updates on my upcoming articles where I discuss topics revolving Cryptocurrencies, Investing in general and Technical Analysis.
Do also follow me on other social media platforms: TwitterYoutube
— — — — — — — — — — — — — — — — — — — — — — — — — — — — — — —
Iliya Zaki is the Community Manager of Chainfund.
Exciting news: Our private sale for MNODE Fund Starts NOW ! Find out here
Founded in 2017, Chainfund offers a 1-Click investment experiencedesigned to be open and accessible to everyone. Chainfund substantiates their highly ambitious nature with their philosophy — investing in high potential Crypto-assets with long-term values and growth.
- Read more on our seamless platform which currently includes Dynamic, Extreme and ICO portfolios on Medium @ https://goo.gl/rArrRp
- Register @ htttp://chainfund.ch to receive exclusively reports and experience 1-Click investment. Investment starts at $1000.
- Join our Telegram Global group — https://t.me/chainfund
Bitcoin Price Analysis — August Month Outlook was originally published in Hacker Noon on Medium, where people are continuing the conversation by highlighting and responding to this story.
Publication date
Disclaimer
The views and opinions expressed in this article are solely those of the authors and do not reflect the views of Bitcoin Insider. Every investment and trading move involves risk - this is especially true for cryptocurrencies given their volatility. We strongly advise our readers to conduct their own research when making a decision.