Latest news about Bitcoin and all cryptocurrencies. Your daily crypto news habit.
I’m one of an estimated 49% to 70% of Americans who counts themselves a fan of the NFL. I’m sure they’re busy preparing for the upcoming 2018 season. Engaging ~200 million US fans can’t be easy.
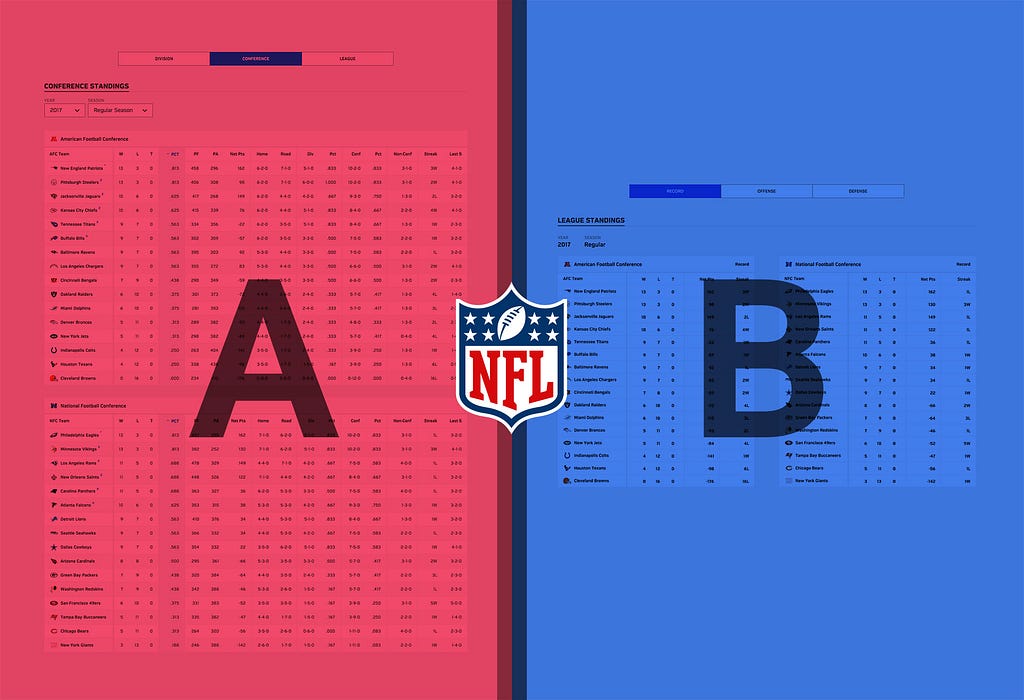
So I thought I’d take some time to help explore the user experience on the NFL.com standings screen. Here is a screenshot of their current interface, minus the ads.
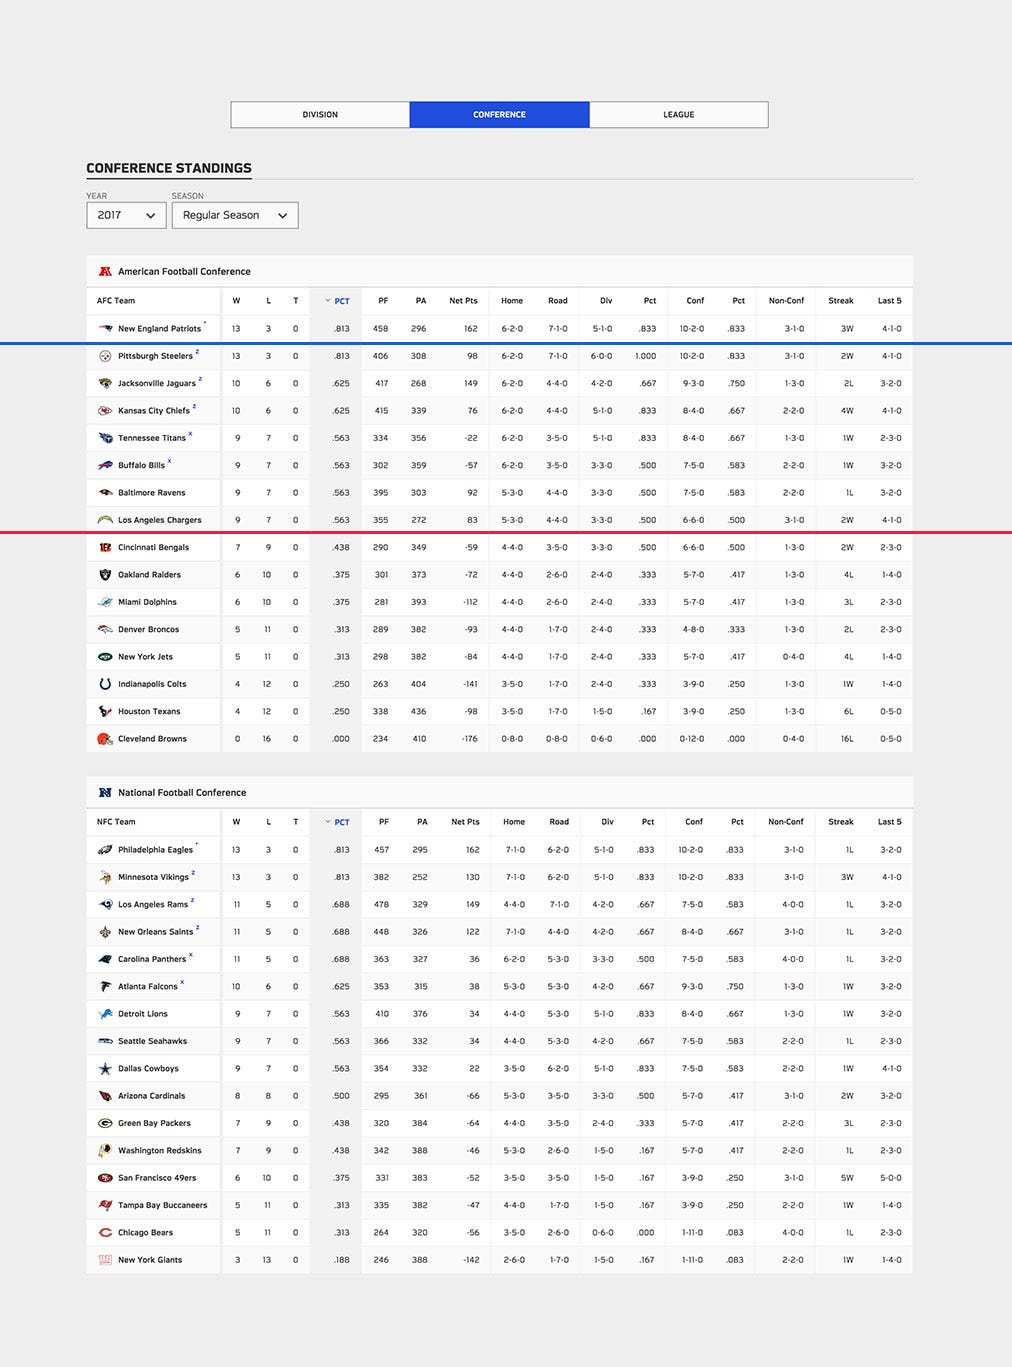
The blue line represents what you can see above the fold on my Macbook Pro with their current navigation. If I delete the navigation, the red line represents the new fold.
This isn’t an exhaustive list, but there are 3 primary issues I’d like to address with this interface:
- It’s very hard to compare teamsUsing so much vertical real estate to represent this data means users are only able to view a small portion of the table at a time. This forces you to scroll up/down hunting for a team. Then you memorize 1–2 relevant data points. Then you hunt for another team and compare your memory to what’s on screen. This is a slow process that breaks down as you try to compare more than 2 teams at once.
- The table is too noisyI seriously don’t think the average fan cares about the percentage of games a team wins within their conference. I consider myself to be a fairly serious fan and the only reason I’d care about half of the columns here is in a playoff tie breaking scenario. In most cases, this extra data is just adding cognitive overhead.
- Unnecessary tabsThe 3 tabs at the top just toggle between showing exactly the same information by clustering teams into different buckets. I do find it nice to see teams bucketed by division but there should be a better solution.
With the above in mind, I created a functional prototype to explore a different approach. Instead of broadly thinking about this as better or worse, try thinking of it as having pros and cons. If the pros make the common user needs easier to achieve, and the cons make uncommon user needs harder to achieve, then the trade off is likely worth it.
This version addresses some of the issues I highlighted above. Showing each conference side-by-side does make comparisons much easier. But, there will always be trade offs. Here are a few potential UX problems and compromises I’ve made with this approach:
- It’s harder to compare divisionsI thought about introducing a new functionality where if you click on a team, it highlights the rows of the teams in the division for comparison. Ultimately, I think that interaction is unintuitive. If you click on a team, the expectation is to see more about that team. Another option is to introduce filters in the same section you select the year. The default could be All Teams followed by North, South, East and West.
- Comparing offense/defense to wins/lossesIf you want to see if offensive or defensive success translates to more wins, you’ve still got to memorize stats, click a button to change the tables and compare your memory to the current state. My assumption is this screen is more for comparing different teams. If you want to do deeper analysis on a single team, the team screen should solve that problem.
- Offense too visually similar to defenseMy initial approach was to add the exact same table columns on offense and defense. This approach makes some sense but the visual similarity adds confusion. This caused me to introduce a label on the top right of the table for Record, Offense and Defense. I am not at all happy with that solution. More thought should be put into figuring out what people are looking for in determining offensive and defensive output and the tables should be more tailored towards those expectations.
- Syncing table animations is a bit jarringWhen you interact with one part of the app and it reacts as expected, great. When another part of the app also reacts to that interaction, your brain is like “Whoa, what’s going on here”. It’s possible this is only a minor annoyance and the overall experience is better so users overcome the friction. Or maybe not. This is definitely something to think about while testing.
 v1Labs.com
Thanks for checking out my latest prototype. 🏈
Feel free to play around with it here and let me know what you think. Also, check out v1Labs and follow me for more UX prototypes!

UX Prototype: NFL Standings Table was originally published in Hacker Noon on Medium, where people are continuing the conversation by highlighting and responding to this story.
Publication date
Disclaimer
The views and opinions expressed in this article are solely those of the authors and do not reflect the views of Bitcoin Insider. Every investment and trading move involves risk - this is especially true for cryptocurrencies given their volatility. We strongly advise our readers to conduct their own research when making a decision.