Latest news about Bitcoin and all cryptocurrencies. Your daily crypto news habit.
This is my first story in medium, in this story I am going to explain “How to Implement simple linear regression using python without any library?”.
Although I have used some basic libraries like pandas, numpy and matplotlib to get dataset, to solve equation and to visualize the data respectively.
You will find the notebook which I have created using sklearn and the dataset in github repository.
I have explained the code below.
import numpy as npimport matplotlib.pyplot as pltclass Regression: def __init__(self): pass def find_sum(l, p): res = 0 for i in l: res += i**p return res def find_mul_sum(l1, l2): res = 0 for i in range(len(l1)): res += (l1[i]*l2[i]) return res def solve_equ(sum_x, sum_x2, sum_y, sum_xy): # Equation no 1 # Ey = a * Ex + b * n # Equation no 2 # Exy = a * Ex^2 + b * Ex n = 30 p = np.array([[sum_x,n], [sum_x2,sum_x]]) q = np.array([sum_y, sum_xy]) res = np.linalg.solve(p, q) return res def predict(x, res): y_pred = [] for i in x: y_pred.append(res[0] * i + res[1]) return y_preddef main(): x = [1.1,1.3,1.5,2,2.2,2.9,3,3.2,3.2,3.7,3.9,4,4,4.1,4.5,4.9,5.1,5.3,5.9,6,6.8,7.1,7.9,8.2,8.7,9,9.5,9.6,10.3,10.5] y = [39343,46205,37731,43525,39891,56642,60150,54445,64445,57189,63218,55794,56957,57081,61111,67938,66029,83088,81363,93940,91738,98273,101302,113812,109431,105582,116969,112635,122391,121872] r = Regression sum_x = r.find_sum(x, 1) sum_y = r.find_sum(y, 1) sum_x2 = r.find_sum(x, 2) sum_xy = r.find_mul_sum(x, y) res = [] res = r.solve_equ(sum_x, sum_x2, sum_y, sum_xy) y_pred = r.predict(x, res) plt.scatter(x, y, color = 'red') plt.plot(x, y_pred, color = 'blue') plt.title('Ownression') plt.xlabel('X') plt.ylabel('Y') plt.show()if __name__ == "__main__": main()Here as you might get the idea that I have created the class Regression with necessary method and for sake of simplicity I have used the basic sample data in X and Y.
First method in class I have created finds the sum of the list with power if know how to get regression co-efficient on paper then I should not be a problem for you.
After getting all the sum we have to create two equations as we are using Least Square Method.
To solve the equation I have used numpy’s method named linalg.solve. By solving the equation we will get one constant which we will use to get the value from x for test dataset. My method to solve equation will return the list of two unknowns “y = a * x + b” here it’ll return a and b.
In predict method it will create the list named y_pred is a list of predicted values of the values that is been passed as a test.
Finally, in the main method it will apply all the methods that I have used and will also plot the graph where points in red color shows the actual values and the blue line shows the predicted values.
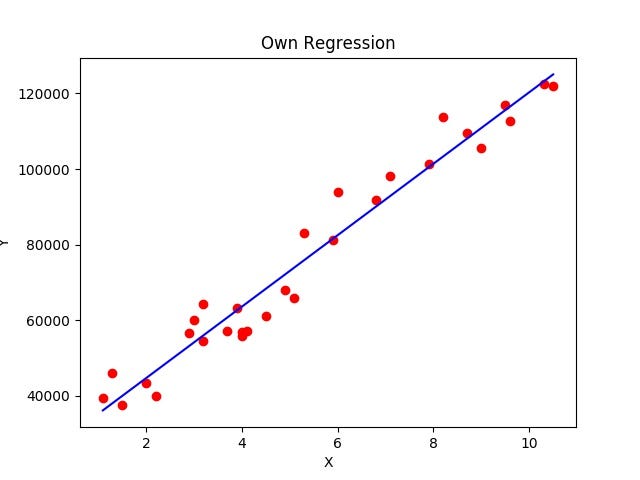 Visualization of linear regression
Hope you liked the article. If you have any kind of question related to this article let me know.
Thank you for reading. :)

Simple linear regression using python without Scikit-Learn was originally published in Hacker Noon on Medium, where people are continuing the conversation by highlighting and responding to this story.
Publication date
Disclaimer
The views and opinions expressed in this article are solely those of the authors and do not reflect the views of Bitcoin Insider. Every investment and trading move involves risk - this is especially true for cryptocurrencies given their volatility. We strongly advise our readers to conduct their own research when making a decision.