Latest news about Bitcoin and all cryptocurrencies. Your daily crypto news habit.
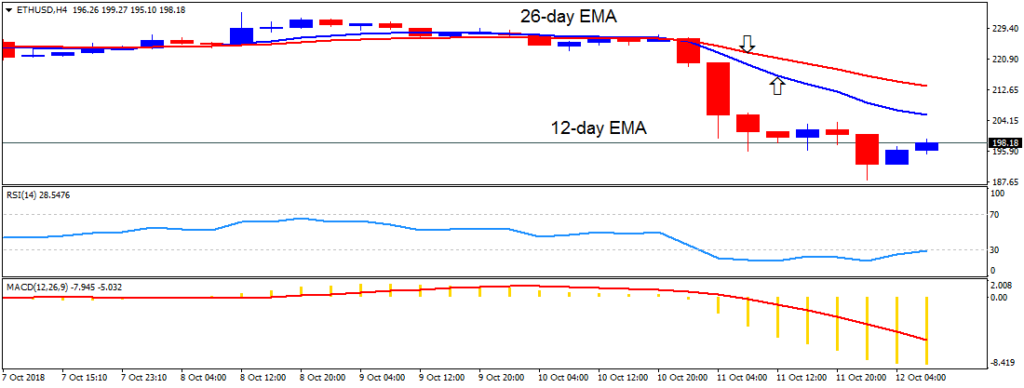
ETH/USD Medium-term Trend: Bearish
Resistance Levels: $240, $260, $280
Support Levels: $180, $160, $140
Yesterday, October 11, the price of Ethereum was in a bearish trend. The price fell to the low of $190.94 and commenced a bullish movement. The digital currency is below the major support level which is the $200 price level. The digital currency is trading at $194.13 as at the time of writing. Ethereum is in a bullish trend.
Ethereum is expected to break the $200 price level upward before it can resume its uptrend. Nevertheless, traders should initiate long trades as the bears have exhausted their bearish trend. Meanwhile, the MACD line and the signal line are below the zero line which indicates a sell signal. In addition, the price of Ethereum is below the 12-day EMA and the 26-day EMA which indicates that price was previously falling.
ETH/USD Short-term Trend: Bullish
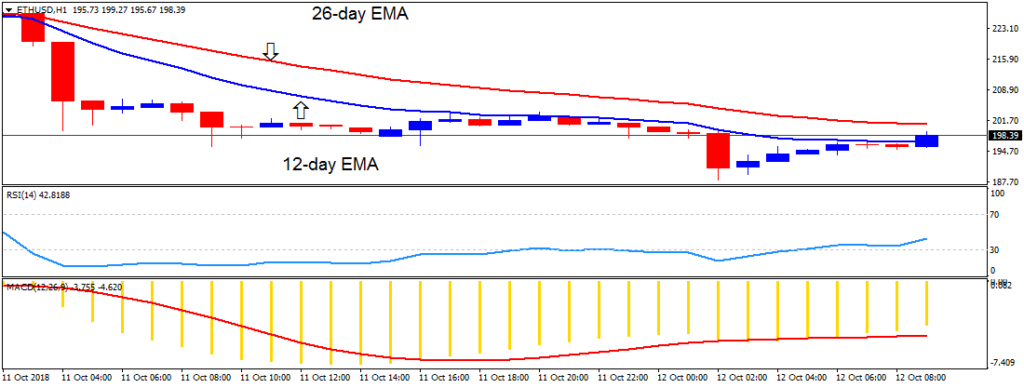
On the 1-hour chart, the price of Ethereum is in a bullish trend. The digital currency is making a bullish movement after Ethereum fell to its low. The 12-day EMA and the 26-day EMA are above the price of the cryptocurrency. The MACD line and the signal line are above the zero line which indicates a buy signal.
The views and opinions expressed here do not reflect that of BitcoinExchangeGuide.com and do not constitute financial advice. Always do your own research.
Publication date
Disclaimer
The views and opinions expressed in this article are solely those of the authors and do not reflect the views of Bitcoin Insider. Every investment and trading move involves risk - this is especially true for cryptocurrencies given their volatility. We strongly advise our readers to conduct their own research when making a decision.