Latest news about Bitcoin and all cryptocurrencies. Your daily crypto news habit.
XRP/USD Medium-term Trend: Bearish
Resistance Levels: $ 0.61, $0.63, $ 0.65
Support Levels: $0.30, $0.28, $0.26
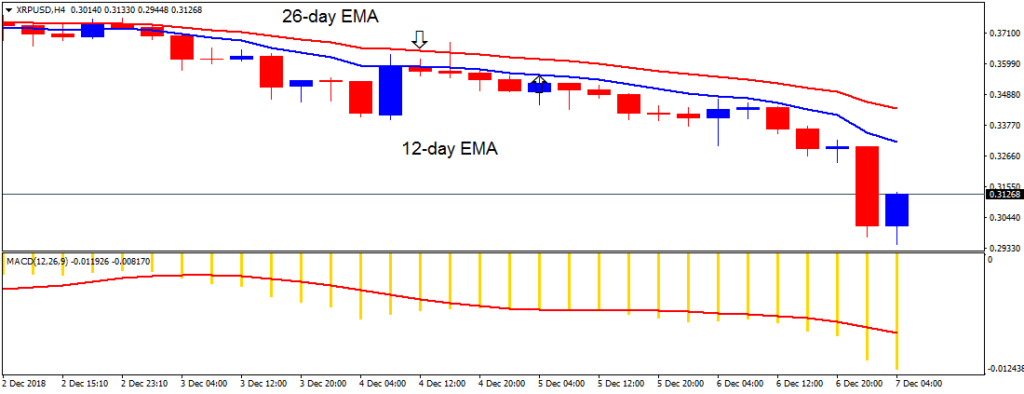
Yesterday, December 6, the XRP price was in a bearish trend. On December 4, the crypto's price was resisted while in a bullish trend by the 12-day EMA. The XRP price fell from the $0.35 price level to the low of $0.30. The bearish trend has broken the previous low of $0.33.
At this price, the crypto was fluctuating between the levels of $0.33 and $0.40 but price is likely to continue its downtrend until it reaches the previous low of $0.24. Meanwhile, the crypto's price is below the 12-day EMA and the 26-day EMA indicating that price is likely to fall. Meanwhile, the MACD line and the signal line are below the zero line which indicates a sell signal line.
XRP/USD Short-term Trend: Bearish
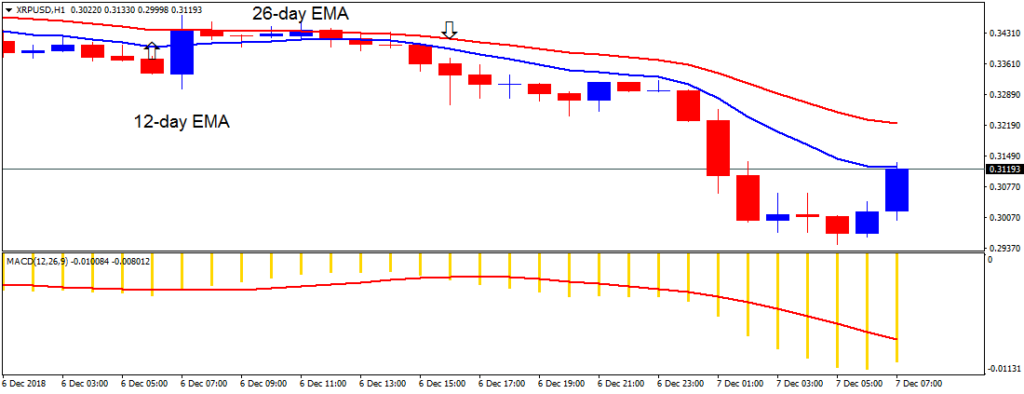
On the 1-hour chart, the price of XRP is in a bearish trend. On December 6, the crypto's price was in a bullish trend when it was resisted by the EMAs. The crypto's price broke the EMAs and fell below the EMAs at the low of $0.33.
The XRP price continued its fall to the low of $0.30. If the crypto's price fall to the previous low of $0.24, traders should look out for buy setups to initiate long trades. Meanwhile, the crypto's price is below the 12-day EMA and the 26-day EMA indicating that price is likely to fall.
The views and opinions expressed here do not reflect that of BitcoinExchangeGuide.com and do not constitute financial advice. Always do your own research.
Publication date
Disclaimer
The views and opinions expressed in this article are solely those of the authors and do not reflect the views of Bitcoin Insider. Every investment and trading move involves risk - this is especially true for cryptocurrencies given their volatility. We strongly advise our readers to conduct their own research when making a decision.