Latest news about Bitcoin and all cryptocurrencies. Your daily crypto news habit.
VET/USD Long-term Trend: Bullish
- Resistance levels: $0.0080, $0.0090, $0.010
- Support levels: $0.0040, $0.0030, $0.0020
The VET/USD pair is now in a bullish trend as price broke the 12-day EMA and the 26-day EMA to the upside. In the same vein, the 12-day EMA and the 26-day EMA are trending northward indicating that the crypto's price is in the bullish trend zone. The crypto's price was at its low at a price of $0.003321 but has risen to the high of $0.00456 in a bullish trend. Nevertheless, the Stochastic indicator is in the range below 80%.
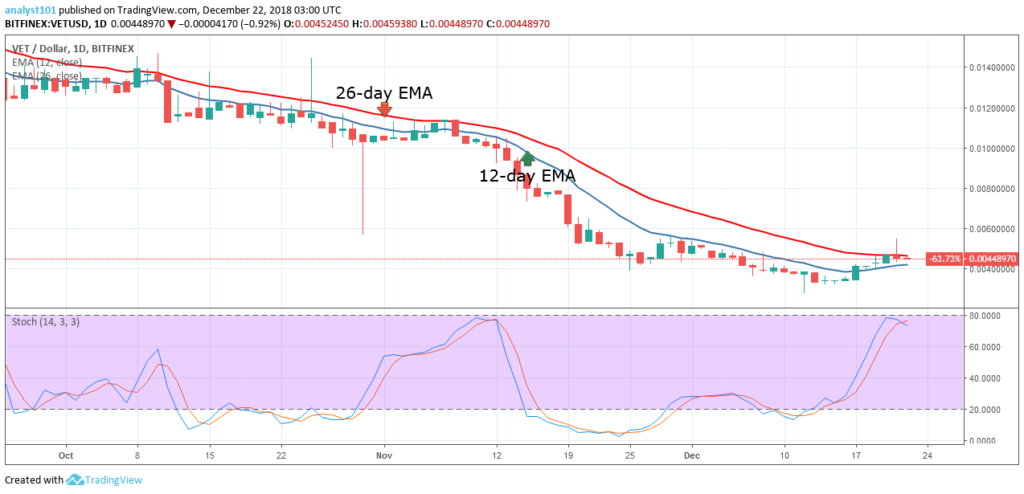
This indicates that Vechain is in a bullish momentum and a buy signal. Previously, the crypto was in the oversold region when the price was in a bearish trend. In addition, the crypto's price is below the 12-day EMA and the 26-day EMA which indicates that price was in a bearish trend. The MACD line and the signal line are below the zero line which indicates a sell signal.
The views and opinions expressed here do not reflect that of BitcoinExchangeGuide.com and do not constitute financial advice. Always do your own research.
Publication date
Disclaimer
The views and opinions expressed in this article are solely those of the authors and do not reflect the views of Bitcoin Insider. Every investment and trading move involves risk - this is especially true for cryptocurrencies given their volatility. We strongly advise our readers to conduct their own research when making a decision.