Latest news about Bitcoin and all cryptocurrencies. Your daily crypto news habit.
Following yesterday’s BTC price analysis, we saw Bitcoin correcting down marking a daily low around the $3700 support line. From there, Bitcoin had returned to the $3800 area, where it’s trading as of writing this.
We talked about such option of a correction which was necessary since the 4-hour chart Stochastic RSI oscillator had crossed over on the overbought area.
As can be seen on the following 30-min chart, Bitcoin made another Bart formation:
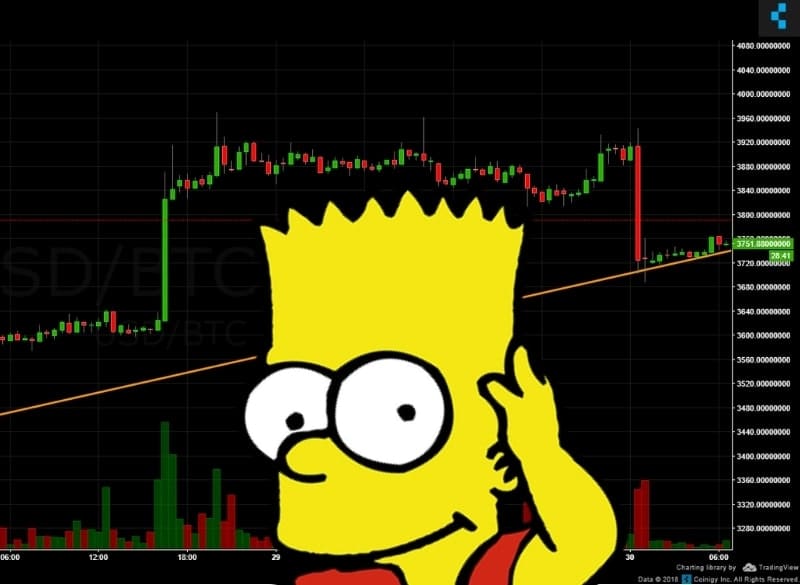
As long as Bitcoin won’t go below the $3500 support area, the possibility for an inverse head and shoulders pattern is still alive: in the case of breaking up the neckline around $4200, we could expect targets around the $5000 area.
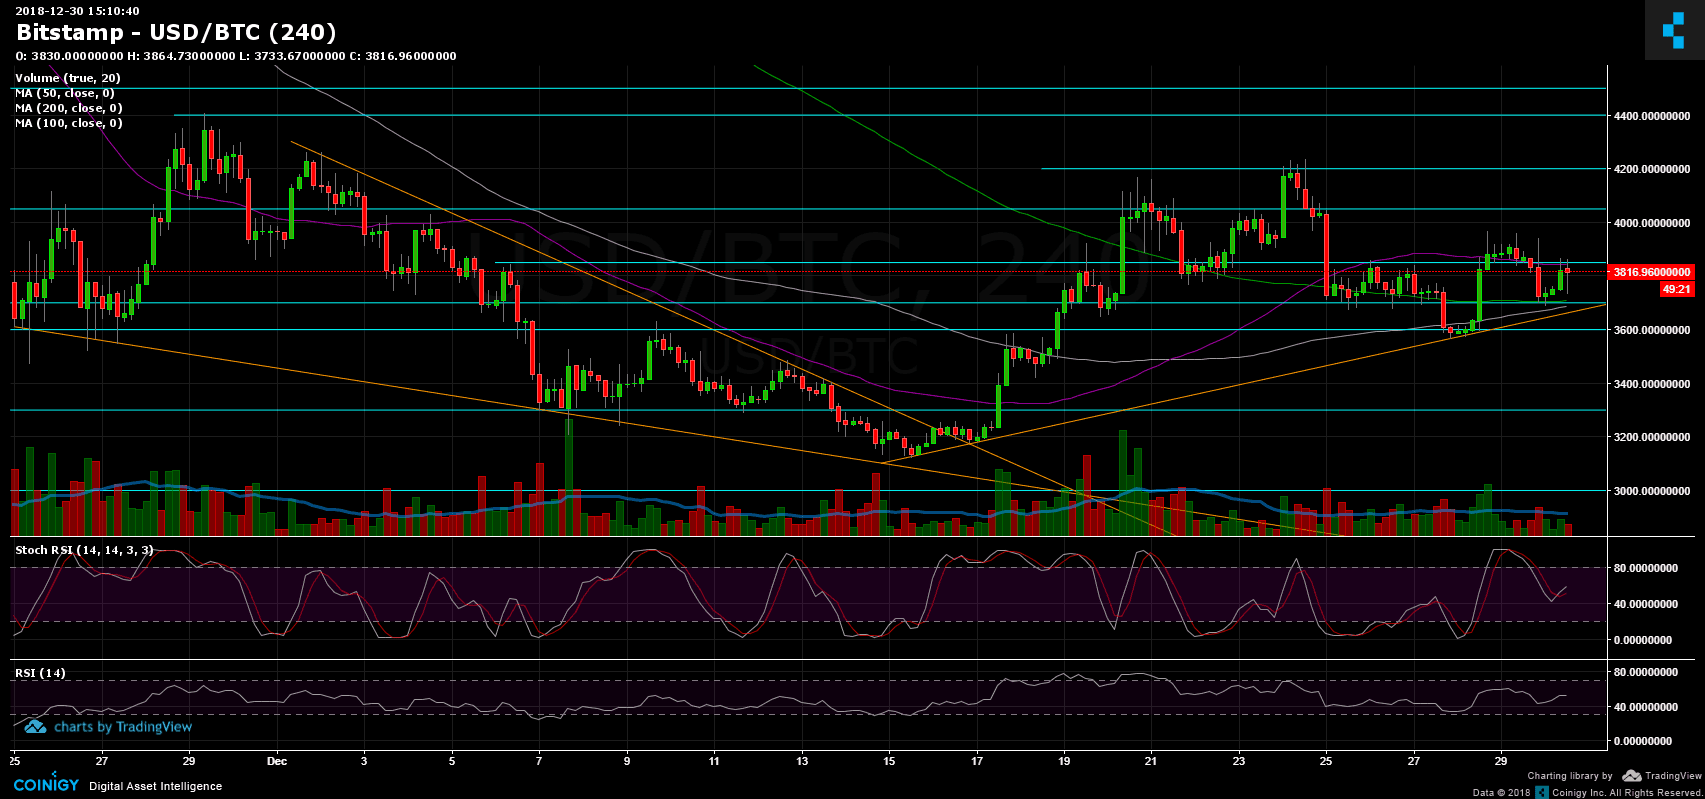
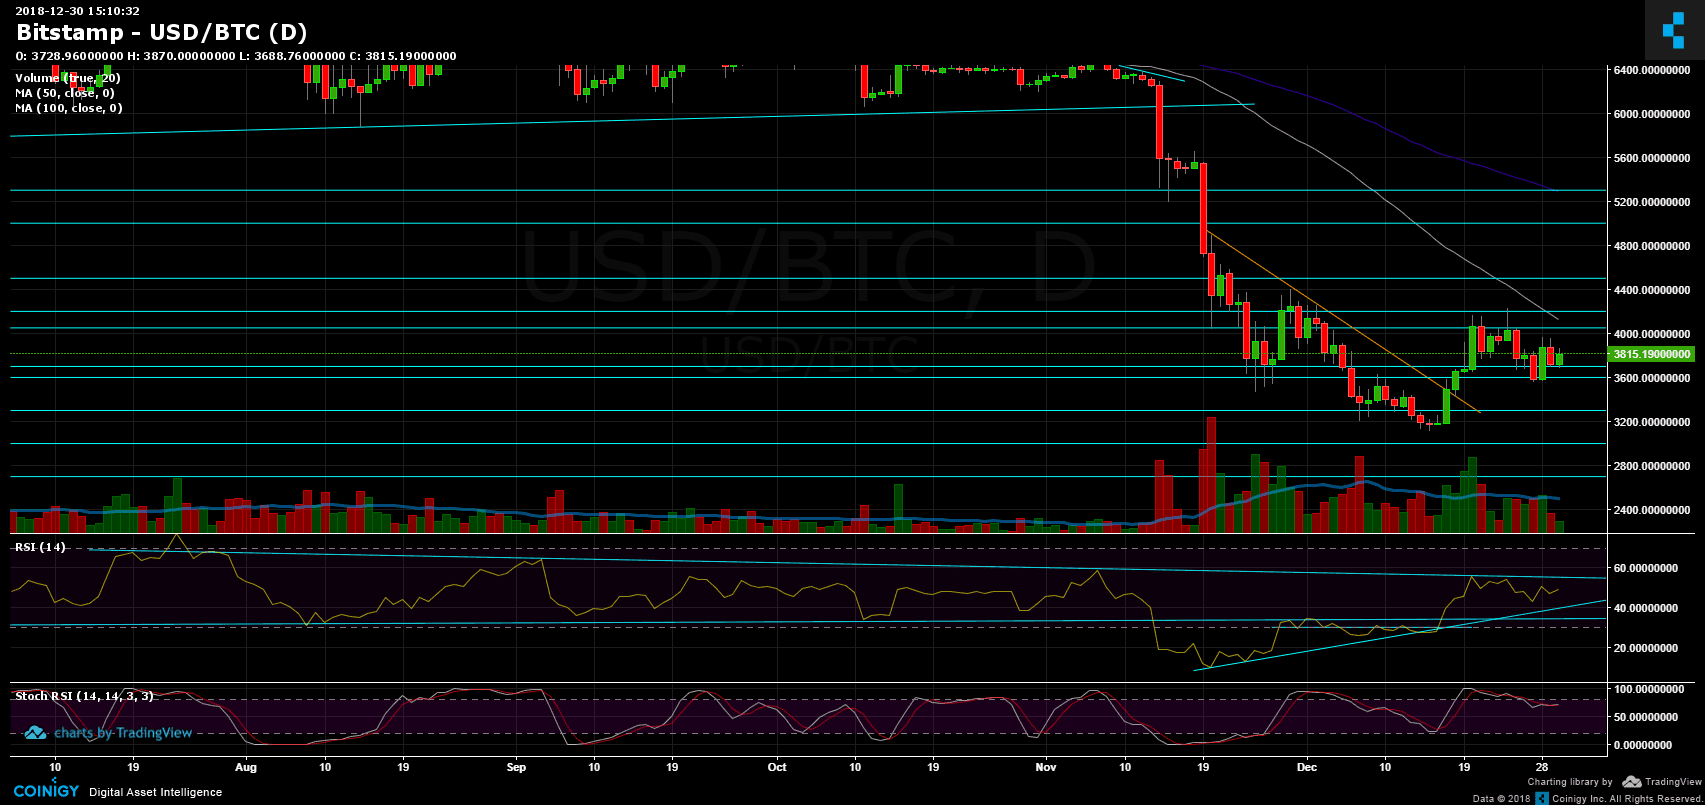
Looking at the 1-day & 4-hour charts
- Following the correction down, Bitcoin found support at the $3700 level, along with the 4-hour chart’s 200 and 100 moving average lines (marked light green and white on the following chart). MA-100 is about to cross over MA-200 which could turn out to be a bullish signal for the mid-term future.
- From the bear side, support in range lies at $3800, $3700 (strong support along with the ascending trend-line), $3600 and $3480.
- From the bull side, resistance levels lie around $3900, $3950, $4050, $4200.
- The trading volume is still low. This is likely because of the weekend along with the holidays.
- BitFinex’s open short positions had increased to 33.2K BTC, not a significant change.
BTC/USD BitStamp 4-Hour chart
BTC/USD BitStamp 1-Day chart
Publication date
Disclaimer
The views and opinions expressed in this article are solely those of the authors and do not reflect the views of Bitcoin Insider. Every investment and trading move involves risk - this is especially true for cryptocurrencies given their volatility. We strongly advise our readers to conduct their own research when making a decision.