Latest news about Bitcoin and all cryptocurrencies. Your daily crypto news habit.
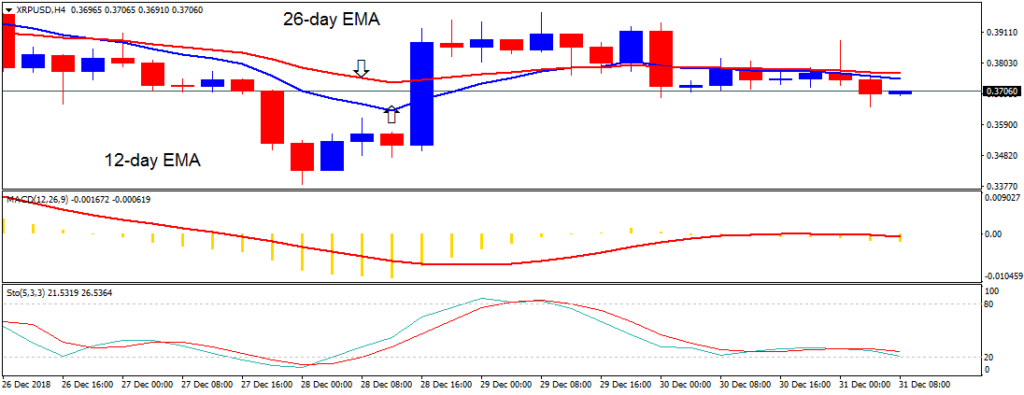
XRP/USD Medium-term Trend: Ranging
Resistance Levels: $ 0.61, $0.63, $ 0.65
Support Levels: $0.35, $0.33, $0.31
Last week the XRP price was in a sideways trend. Since on December 29, the 12-day EMA and the 26-day EMA were horizontally flat indicating that XRP price was in a sideways trend. On December 30, the crypto’s price broke the 12-day EMA, the 26-day EMA and fell to the low of $0.37. Today, the crypto’s price is ranging at the $0.37 price level.
On the downside, if the crypto’s price breaks the $0.35 price level, the XRP price will find support at the lows of $0.33 and $0.29 price level. On the upside, if the bulls break the $0.40 price level, the crypto will reach the highs of $0.45 and $0.50 price levels.
XRP/USD Short-term Trend: Ranging
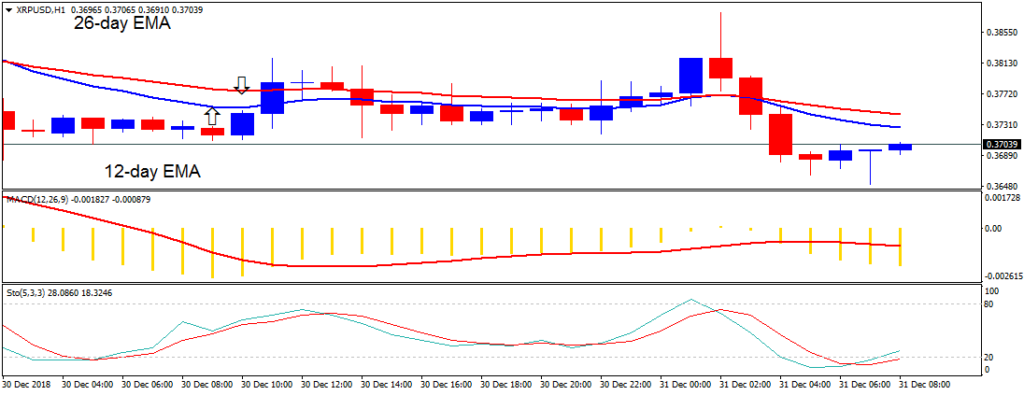
On the 1-hour chart, the price of XRP is in a sideways trend. On December 30, the XRP price fell to the low of $0.37 and commenced a range bound movement. The range bound movement is characterized by small body candlesticks like Doji and spinning tops which described the indecision of buyers and sellers at that price level.
Today, the XRP price has broken the EMAs to the bearish trend zone. Meanwhile, the MACD line and the signal line are below the zero line which indicates a sell signal. Also, the crypto’s price is below the 12-day EMA and the 26-day EMA which indicates that price is likely to fall.
The views and opinions expressed here do not reflect that of BitcoinExchangeGuide.com and do not constitute financial advice. Always do your own research.
Publication date
Disclaimer
The views and opinions expressed in this article are solely those of the authors and do not reflect the views of Bitcoin Insider. Every investment and trading move involves risk - this is especially true for cryptocurrencies given their volatility. We strongly advise our readers to conduct their own research when making a decision.