Latest news about Bitcoin and all cryptocurrencies. Your daily crypto news habit.
LTC/USD Long-term Trend: Bearish
- Resistance Levels: $60, $70, $80
- Support levels: $30, $20, $10
The LTC/USD pair was in a sideways trend in the last ten days. The crypto’s price was fluctuating above the $30 price level. The price action was characterized by small body candlesticks describing the indecision of buyers and sellers above the $30 price level. The 12-day EMA and the 26-day EMA were horizontally flat in the daily time frame indicating the sideways trend.
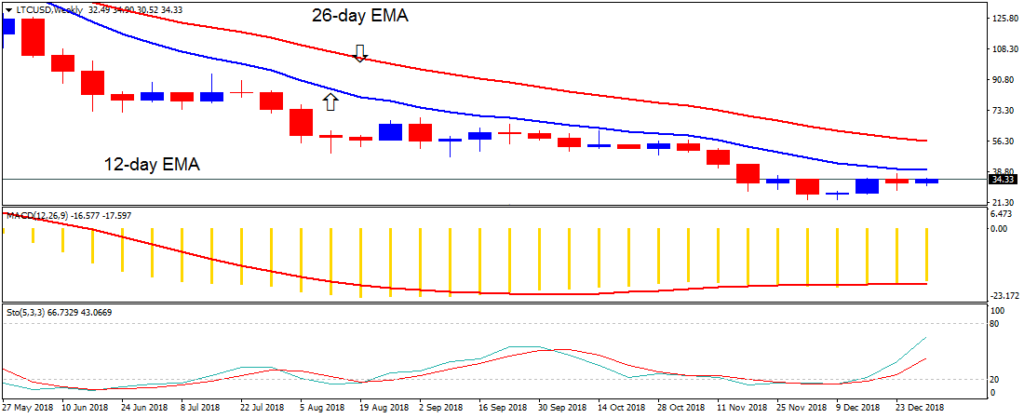
From the weekly chart, the price of Litecoin was in a bearish trend zone. The crypto’s price is below the 12-day EMA and the 26-day EMA which indicates that price is likely to fall.
Also, the MACD line and the signal line are below the zero line which indicates a sell signal. The stochastic indicator is out of the oversold region but above the 20% range indicating that the price of Litecoin is in a bullish momentum and a buy signal.
The views and opinions expressed here do not reflect that of BitcoinExchangeGuide.com and do not constitute financial advice. Always do your own research.
Publication date
Disclaimer
The views and opinions expressed in this article are solely those of the authors and do not reflect the views of Bitcoin Insider. Every investment and trading move involves risk - this is especially true for cryptocurrencies given their volatility. We strongly advise our readers to conduct their own research when making a decision.