Latest news about Bitcoin and all cryptocurrencies. Your daily crypto news habit.
BTC/USD Medium-term Trend: Bullish
- Resistance Levels: $6,800, $6,900, $7,000
- Support levels: $3,900, $3,800, $3, 700
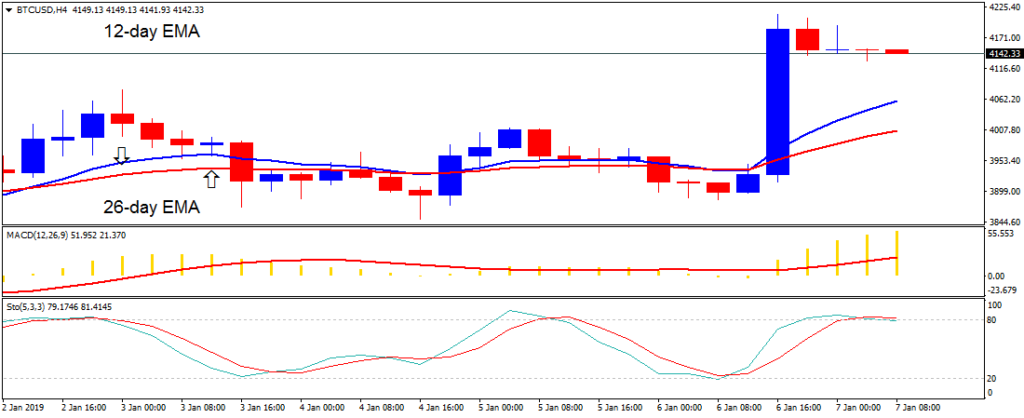
Last week the price of Bitcoin was in the bearish trend zone. The BTC price was trading below the $3,900 price level. The crypto’s price fluctuates below and above the $3,900 price level. On January 6, the BTC price broke the 12-day EMA and the 26-day EMA and it is now in the bullish trend zone. The crypto’s price reached the high of $4,212.66 after breaking the EMAs.
The BTC price also broke above the $3,900 price level. Meanwhile, the stochastic indicator is approaching the overbought region but above the 80% range. This implies that Bitcoin is in a bullish momentum and a buy signal. Also, the MACD line and the signal line are above the zero line which indicates a buy signal.
BTC/USD Short-term Trend: Bullish
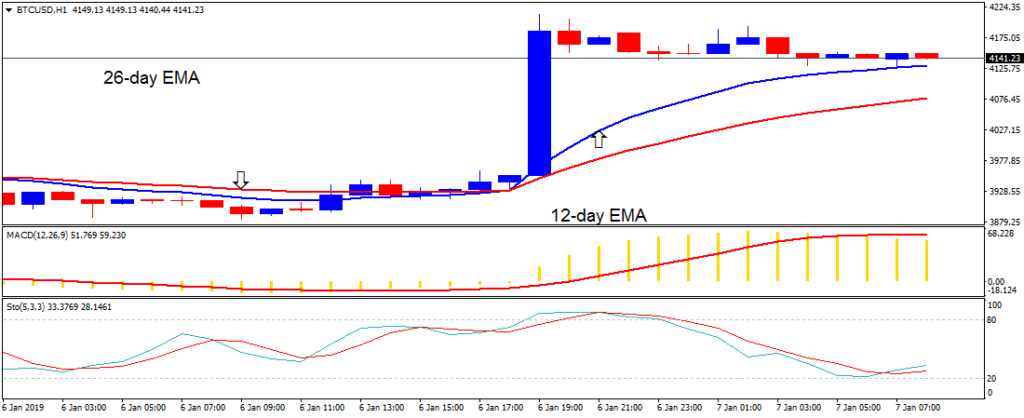
On the 1-hour chart, the price of Bitcoin is in a bullish trend zone. The bulls broke the 12-day EMA and the 26-day EMA to reach the high of $ 4,212. The BTC price retraced and it is now fluctuating above the $4100 price level. There is a tendency for the crypto to rise because Bitcoin is in the bullish trend zone. The stochastic is out of the overbought region but above 20% range indicating that Bitcoin is in a bullish momentum and a buy signal.
The views and opinions expressed here do not reflect that of BitcoinExchangeGuide.com and do not constitute financial advice. Always do your own research.
Publication date
Disclaimer
The views and opinions expressed in this article are solely those of the authors and do not reflect the views of Bitcoin Insider. Every investment and trading move involves risk - this is especially true for cryptocurrencies given their volatility. We strongly advise our readers to conduct their own research when making a decision.