Latest news about Bitcoin and all cryptocurrencies. Your daily crypto news habit.
BTC/USD Medium-term Trend: Ranging
- Resistance Levels: $6,800, $6,900, $7,000
- Support levels: $3,900, $3,800, $3, 700
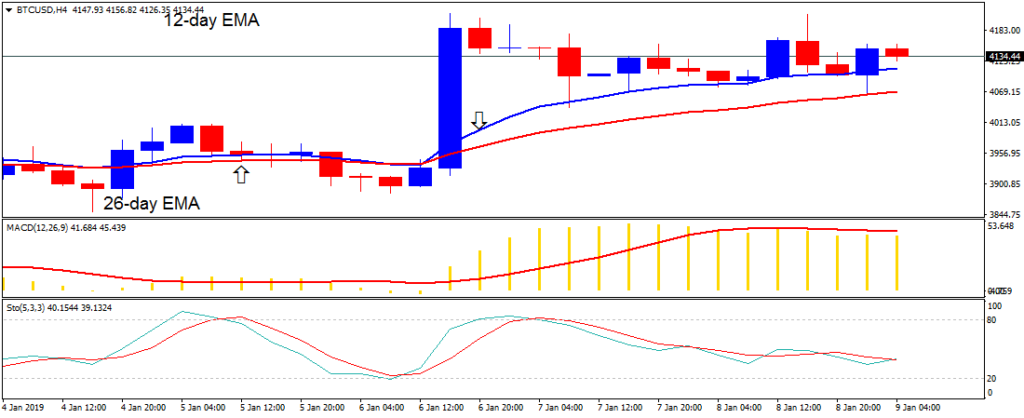
Yesterday, January 8, the price of Bitcoin was in a bullish trend. In the last 48 hours, the price of Bitcoin had been ranging above the $4,100 price level. The bulls have succeeded to hold price above the 12-day EMA and the 26-day EMA. All the retraced candlesticks are well supported above the 12-day EMA. The crypto is currently facing resistance at the $4,200 price level.
If the bulls break the $4,200 price level, Bitcoin will reach the high of $4,500. Meanwhile, the MACD line and the signal line are above the zero line which indicates a buy signal. Also, the stochastic indicator is below the 40% range which indicates that the price of Bitcoin is in a bearish momentum and a sell signal.
BTC/USD Short-term Trend: Ranging
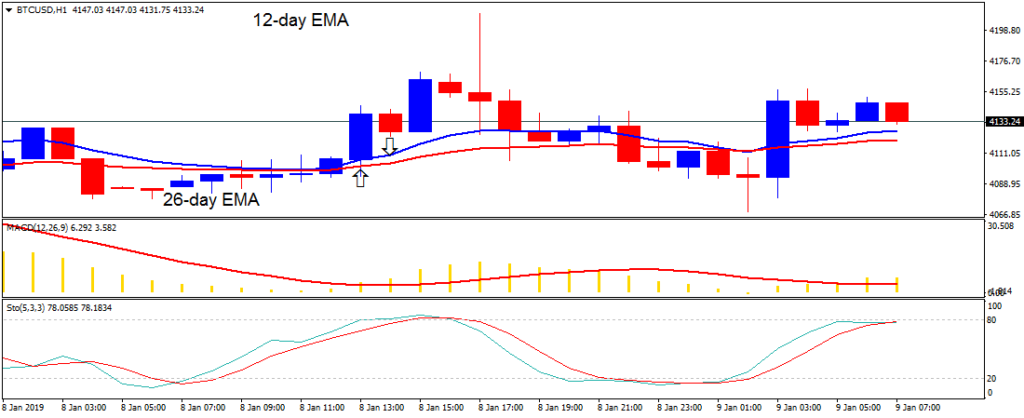
On the 1-hour chart, the price of Bitcoin is in a bullish trend zone. On January 8, the BTC price was resisted as the crypto fell and broke below the 12-day EMA and the 26-day EMA. A large bullish candlestick has broken above the EMAs.
Meanwhile, the MACD line and the signal line are below the zero line which indicates a sell signal. Also, the stochastic bands are in the overbought region below the 80% region which indicates that BTC price is in a bullish momentum and a buy signal.
The views and opinions expressed here do not reflect that of BitcoinExchangeGuide.com and do not constitute financial advice. Always do your own research.
Publication date
Disclaimer
The views and opinions expressed in this article are solely those of the authors and do not reflect the views of Bitcoin Insider. Every investment and trading move involves risk - this is especially true for cryptocurrencies given their volatility. We strongly advise our readers to conduct their own research when making a decision.