Latest news about Bitcoin and all cryptocurrencies. Your daily crypto news habit.
BTC/USD
From yesterday’s open at $3596 the price of Bitcoin has been bouncing inside of a range between there which was the range resistance line to $3556 which is a lower support level of the mentioned range.
Today the price went on to increase after the second interaction with the lower support level and from there it up to $3648 where it is currently sitting which is an increase of 2.54%. But since the price has encountered some resistance at the current levels it is in question if the rise will continue for much longer.
Looking at the 15 min chart you can see that the price has broken out from the mentioned range on the upside and has also broken the prior horizontal support (interrupted purple line) and is currently inside the prior range from which a breakout occurred previously with strong momentum.
The wave structure looks impulsive although I don’t believe that its the start of an impulsive move altogether, it is more likely that this is a retest of the prior support level for resistance which is why next I would be expecting an interaction with the 0.382 Fibonacci level or in price terms at $3666, before further downtrend continuation.
As the previous move was an impulsive move to the downside this is the 4th wave to the upside before another drop according to my Elliott Wave count, so after it ends I would be expecting that the price falls to the next Fibonacci level at $3499.
ETH/USD
From yesterday’s open at $119.2 the price of Ethereum has like Bitcoin been stuck bouncing inside a range from those levels which are around the range resistance level to $115.65 which is the range support level. The price came down today to $112.34 at its lowest spike which ended as a wich even on the 15 min chart which means that the dip activated buying since the price has been on the rise since and is currently at $120.22 which is an increase of 0.97% from yesterday’s open.
On the 15 min chart, you can see that the price is currently above the 0.382 Fibonacci level and is retesting it for support from the upside. This is a result of a breakout momentum that occurred after a quick dip, which was pushed the price above the range resistance levels and slightly above the mentioned Fibonacci level.
The price is on the intersection between the horizontal Fibonacci level and the descending channels which can be seen on a higher time-frame, resistance line which is why we are seeing a cluster forming. This indicates a struggle between buyers and the sellers but as the momentum is bullish we might see further breakouts to the upside but wicks from the upside on the current candles don’t bring a lot of confidence in that scenario.
I would be expecting an immediate rejection from these levels and further downside as the final Z wave should end significantly lower than the current levels, potentially all the way down to $102 per ETH.
XRP/USD
On yesterday’s open the price of Ripple was at $0.32283. From there the price fell at first since it interacted with the resistance level to $0.31889 which was the first support line of the range in which the price of Ripple was bouncing throughout most of the day.
Since the price interacted with the ranges’ support level another increase was made this time slightly higher than on the opening price as the price came up to $0.32498. Onward the price fell again to the support level of the range but this time slightly lower than the previous low as it came down to $0.31819 which was close to the today’s open.
Today the price went on to increase again but after it came to the prior high lower level it fell this time even lower to $0.3157 and even spiking further down to $0.31 but the buyers have immediately brought the price back up to above the support line of the mentioned range, and ultimately this led to a breakout from the range on the upside as the buying momentum was caught.
On the 15-min chart, you can see that the price action has created an expanding triangle out of the previous horizontal range since the price created higher highs and lower lows. Looking at the wave structure I have outlined that the current upward move must be the third corrective structure to the upside which means that after it ends more downside would be expected for the price of Ripple.
More downside is expected due to the fact that the price has been in a Minor WXYXZ correction from 24th of December when the price of Ripple experienced the impulsive move in which more than 60% recovery has been made, and as the previous structure to the upside was most likely the second wave X, the final wave Z should push the price to around $0.3 which is the price target.
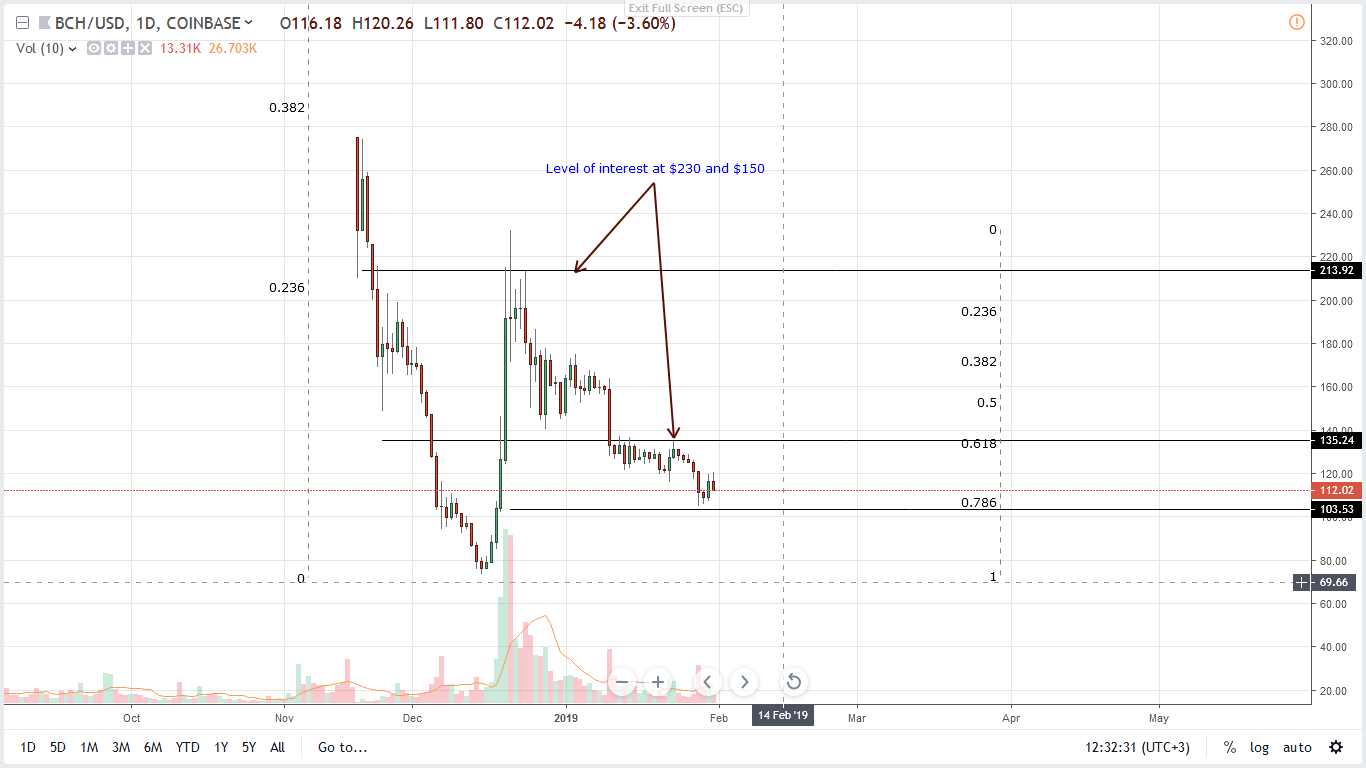
BCH/USD
From yesterday’s open at $122 the price of Bitcoin Cash has fallen today to $120 at its lowest point. From there, an increase occurred as the price is currently around $130 level.
Looking at the hourly chart you can see a similar chart pattern like in the case of other analyzed coins except I have labeled it differently. According to these alternative labelings which I have chosen to display can also be applied to the previous analysis.
What is different in this scenario is that the Minute X wave ended today on the dip which we have seen al more or less all cryptos. This could be highly possible since the impulsive move that we have seen on t14th of January, Monday last week, resembles the current one which could be interpreted as the Y wave because of the similarities in momentum.
If we are to project the W wavelength on to the assumed X wave ending point we come up with a target of $133.3 for the Y wave which would be slightly lower than the ending point of the W wave, which is only natural considering that the X wave is also lower than the starting point of the W wave.
Ultimately in every scenario, the same implies – this would be only either a prolongation of the second wave X or the start of the final Z wave to the upside out of which the current upside movement is the corrective wave.
The target price for the expected decrease would be around $104 area which is where the most significant horizontal support line is below the current one.
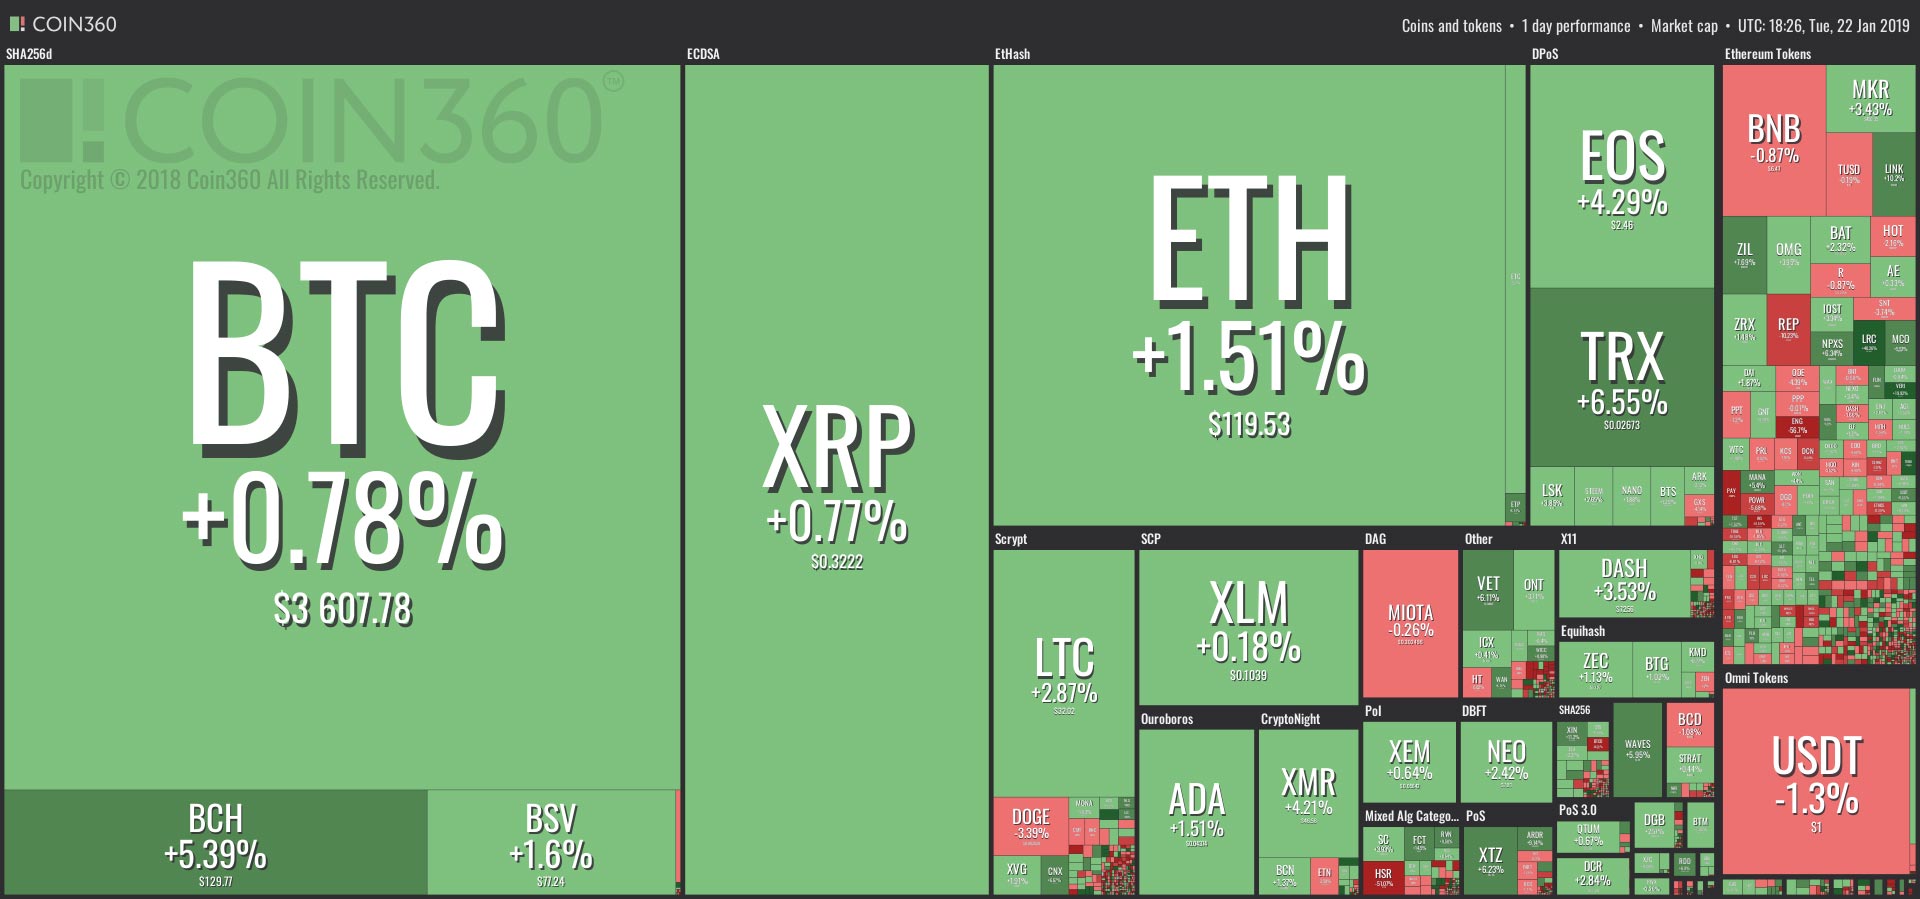
Overall Market Outlook
Disclaimer: The technical analysis and prices quoted here are not meant as investment advice. Do your own research before investing.
Publication date
Disclaimer
The views and opinions expressed in this article are solely those of the authors and do not reflect the views of Bitcoin Insider. Every investment and trading move involves risk - this is especially true for cryptocurrencies given their volatility. We strongly advise our readers to conduct their own research when making a decision.