Latest news about Bitcoin and all cryptocurrencies. Your daily crypto news habit.
EOS/USD Medium-term Trend: Bearish
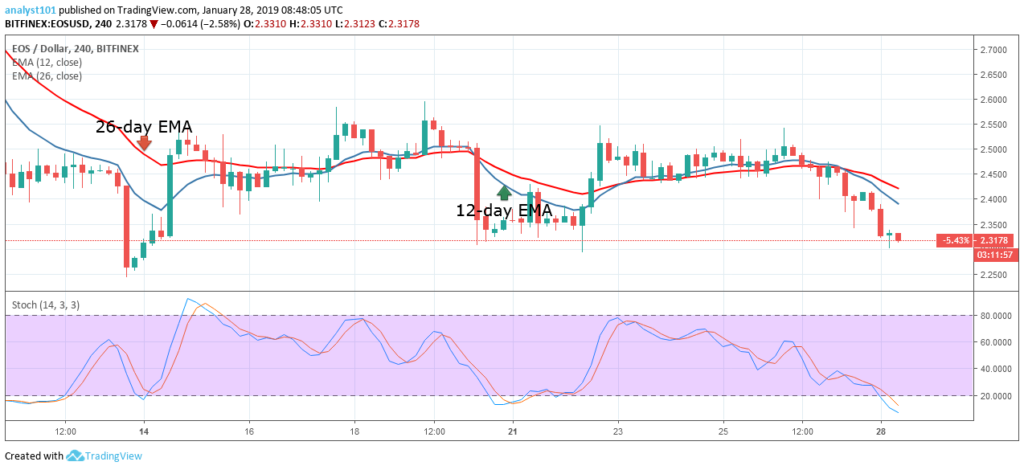
- Resistance levels: $ 6, $7, $8.
- Support levels: $3, $2, $1.
Last week the price of EOS was in the bearish trend zone. On January 22, the bulls broke the 12-day EMA and the 26-day EMA as the crypto reached the high of $2.54. The crypto’s price began a range bound movement above the 12-day EMA and the 26-day EMA at the price of $2.54. On January 26, the bears resisted price as it broke the EMAs to the low of $2.32.
The crypto’s price has reached the previous low at $2.33 price level. If the $2.33 price level is holding, traders should initiate long trades in anticipation of a bullish trend. Meanwhile, the stochastic is in the oversold region but below the 20% range. This indicates that the price of EOS is in a bearish momentum and a sell signal. The crypto’s price is below the EMAs which indicates that price is in the bearish trend zone.
EOS/USD Short-term Trend: Bearish
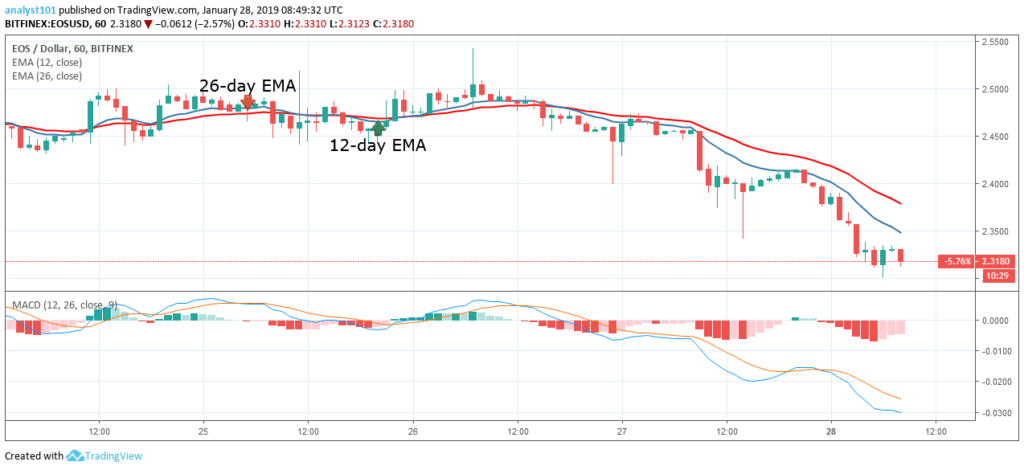
On the 1-hour chart, the price of EOS is in a bearish trend zone. Last week the crypto’s price fluctuates below and above the EMAs but on January 26, the bears broke the EMAs to the bearish trend zone. The 12-day EMA provides resistance to the crypto’s price. Today, the crypto’s price fell to the $2.31 price level and commenced a range bound movement. The MACD line and the signal line are below the zero line which is a sell signal.
The views and opinions expressed here do not reflect that of BitcoinExchangeGuide.com and do not constitute financial advice. Always do your own research.
Publication date
Disclaimer
The views and opinions expressed in this article are solely those of the authors and do not reflect the views of Bitcoin Insider. Every investment and trading move involves risk - this is especially true for cryptocurrencies given their volatility. We strongly advise our readers to conduct their own research when making a decision.