Latest news about Bitcoin and all cryptocurrencies. Your daily crypto news habit.
Bitcoin (BTC/USD)
On today’s open the price of Bitcoin was $3507. From there which was the end of the 4th wave, the price continued its downward trajectory and came down to $3430 at its lowest point today as it was searching for support on the descending wedge support line since the price interacted with it another increase has been made and the price is currently at $3471.3 which is an overall decrease of 1.2% from today’s open.

Looking at the 15-min chart you can see that the price found support on the descending wedge support as the level was well respected and the candles closed above it. Since the interaction, the price has started its upward trajectory but it encountered resistance at the 0.236 Fibonacci retracement level which was previously broken.
Now that the price encountered the first significant resistance on the upside it is likely heading for a minor pullback before continuing its upward trajectory. As the 5th Minuette impulse wave ended so did the Z wave from a Minor WXYXZ correction which is the Intermediate X wave from a higher degree count.
The Y wave from that Intermediate count is expected to start which is why more upside is expected for the price of Bitcoin in the upcoming period but we might see a period of consolidation before this happens.
If what we have seen today is the start of the Y wave we are going to see the price start increasing impulsively to the upside. That move to the upside will most likely be around the same momentum as the impulsive move we have seen from 15th to 24th of December when the price of Bitcoin came up from $3240 to $4374.
Ethereal (ETH/USD)
From today’s open at $108.45 the price of Ethereum has been falling down and came to $104.3 at its lowest point today. From there the price started increasing again and came up to around the levels of today’s open but encountered resistance at the prior resistance point which is why it started pulling back again to the minor horizontal support.
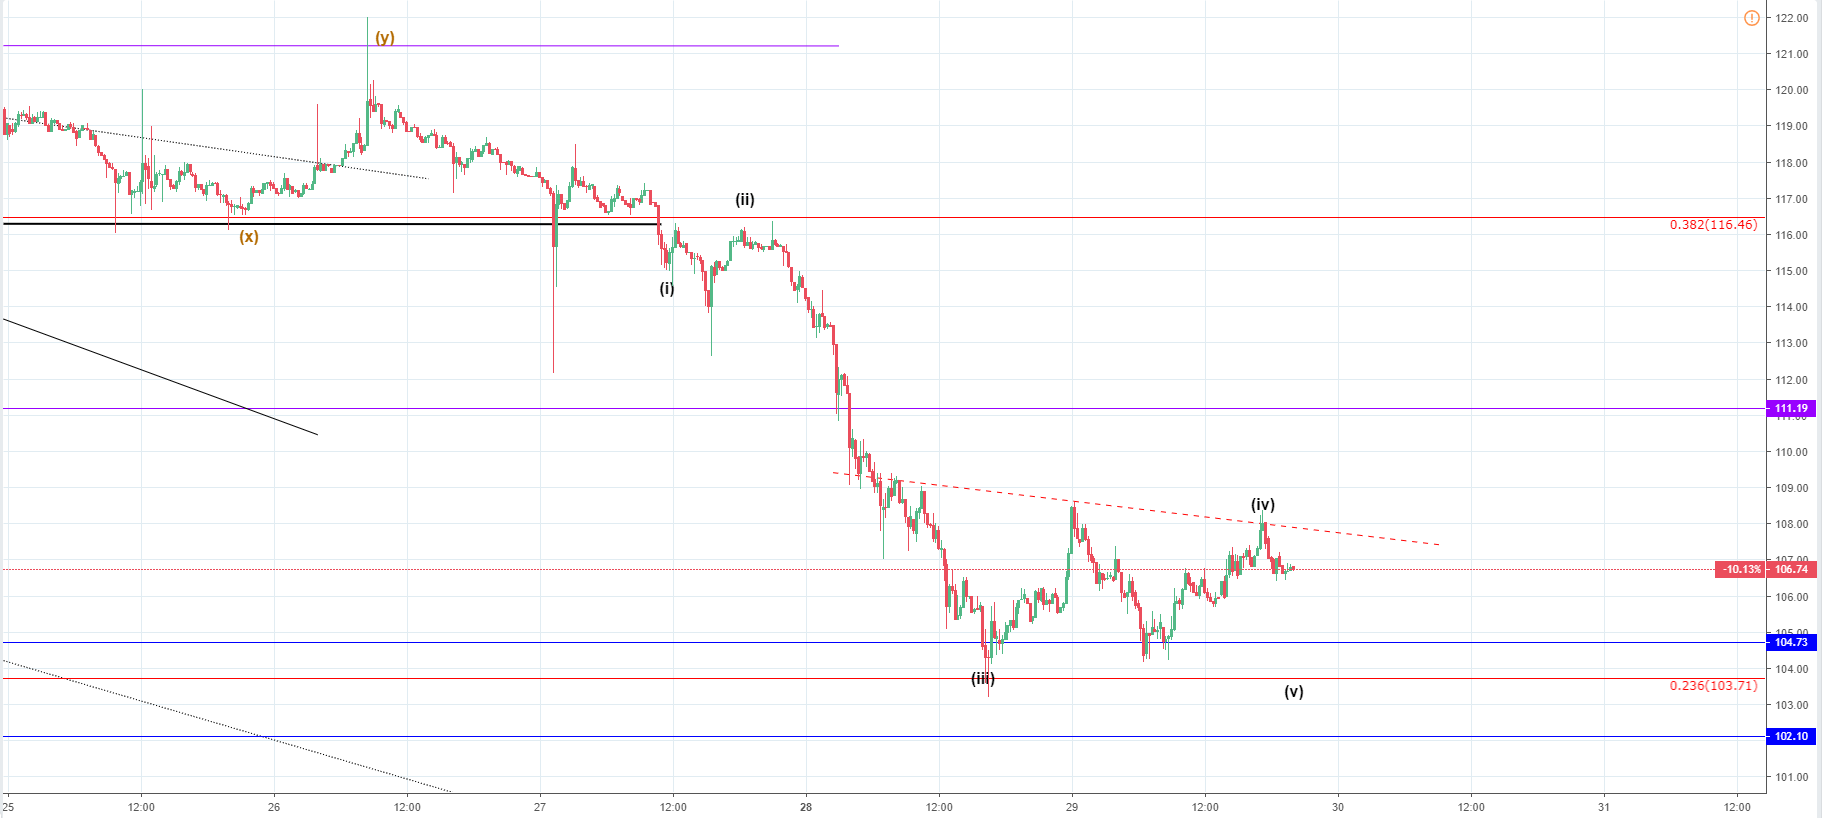
Looking at the 15 min chart you can see that the price of Ethereum started a correction since the interaction with the $104 horizontal level so this correction could be interpreted as the 4th wave from the impulsive move to the downside or it is the first move to the upside after the 5-wave impulse ended.
The resistance from the 4th corrective wave has been outlined so if the price now doesn’t go further down below $106 and start increasing again going above the resistance level I would consider that the 5-wave impulse to the downside has ended and that we are seeing the start of the new wave to the upside.
The other possibility is that the the upper resistance line is the resistance from a descending triangle that is yet to be established with another verification of its support line before another low is to occur as the 5th wave, in that case, hasn’t started like depicted on the chart.
In either way, a reversal is on the horizon as the move to the downside is near completion. The expected reversal would be the the third Intermediate wave Y from a higher degree count so the completion of the wave Z from a Minor WXYXZ that has developed is the X wave of that higher degree count.
Ripple (XRP/USD)
On today’s open the price of Ripple was $0.2993 and from there the price fell at first to $0.285 horizontal level for interaction with the lower support level off of the support zone with which the price is currently interacting but the interaction ended as a large wick on the 15-min chart as the price quickly came back up above its current horizontal support and then back to slightly below the level of today’s open making a lower high.

The price of Ripple is like in the case of Bitcoin and Ethernet in its final stages of the Minor WXYXZ correction so a reversal is soon to be expected, but the ending point of the Z wave is hard to call out because of the sideways movement that we have seen recently.
As you can see from the 15 min chart the 5th wave completion is still awaited or a confirmation that it has ended. This will be confirmed if the price starts increasing again and breaks the still yet to be validated descending triangle but as the current price action pattern indicates we might see another low and proper interaction with the previously interacted lower support level.
The refereed triangle could be a bearish pennant but another expanding structure looks like it is intersecting the triangle which is not labeled on the chart as there is still no confirmation but if the 5th wave hasn’t started and it does go the the lower support line the expanding structure will start to appear more clearly.
The expanding triangle or a channel on the end of the correction usually indicates a large move ahead so this could very much be the possible scenario.
If the price of Ripple immediately goes below the outlined triangle’s support line I would believe that the 5th wave is playing out as the 4th wave ended as a three wave correction, but if not I would think that the 4th wave could be prolonged by two more waves.
In order to be 100% positive that the WXYXZ correction ended and that the impulsive move the the upside started, we are going to look out for the price going above today’s open and make a higher high.
If the price goes to around the vicinity of today’s open and finds resistance there, that would most likely mean that the 5th wave is going to start from there and another low is coming before the expected trend reversal.
Publication date
Disclaimer
The views and opinions expressed in this article are solely those of the authors and do not reflect the views of Bitcoin Insider. Every investment and trading move involves risk - this is especially true for cryptocurrencies given their volatility. We strongly advise our readers to conduct their own research when making a decision.