Latest news about Bitcoin and all cryptocurrencies. Your daily crypto news habit.
Bitcoin BTC/USD Price Analysis
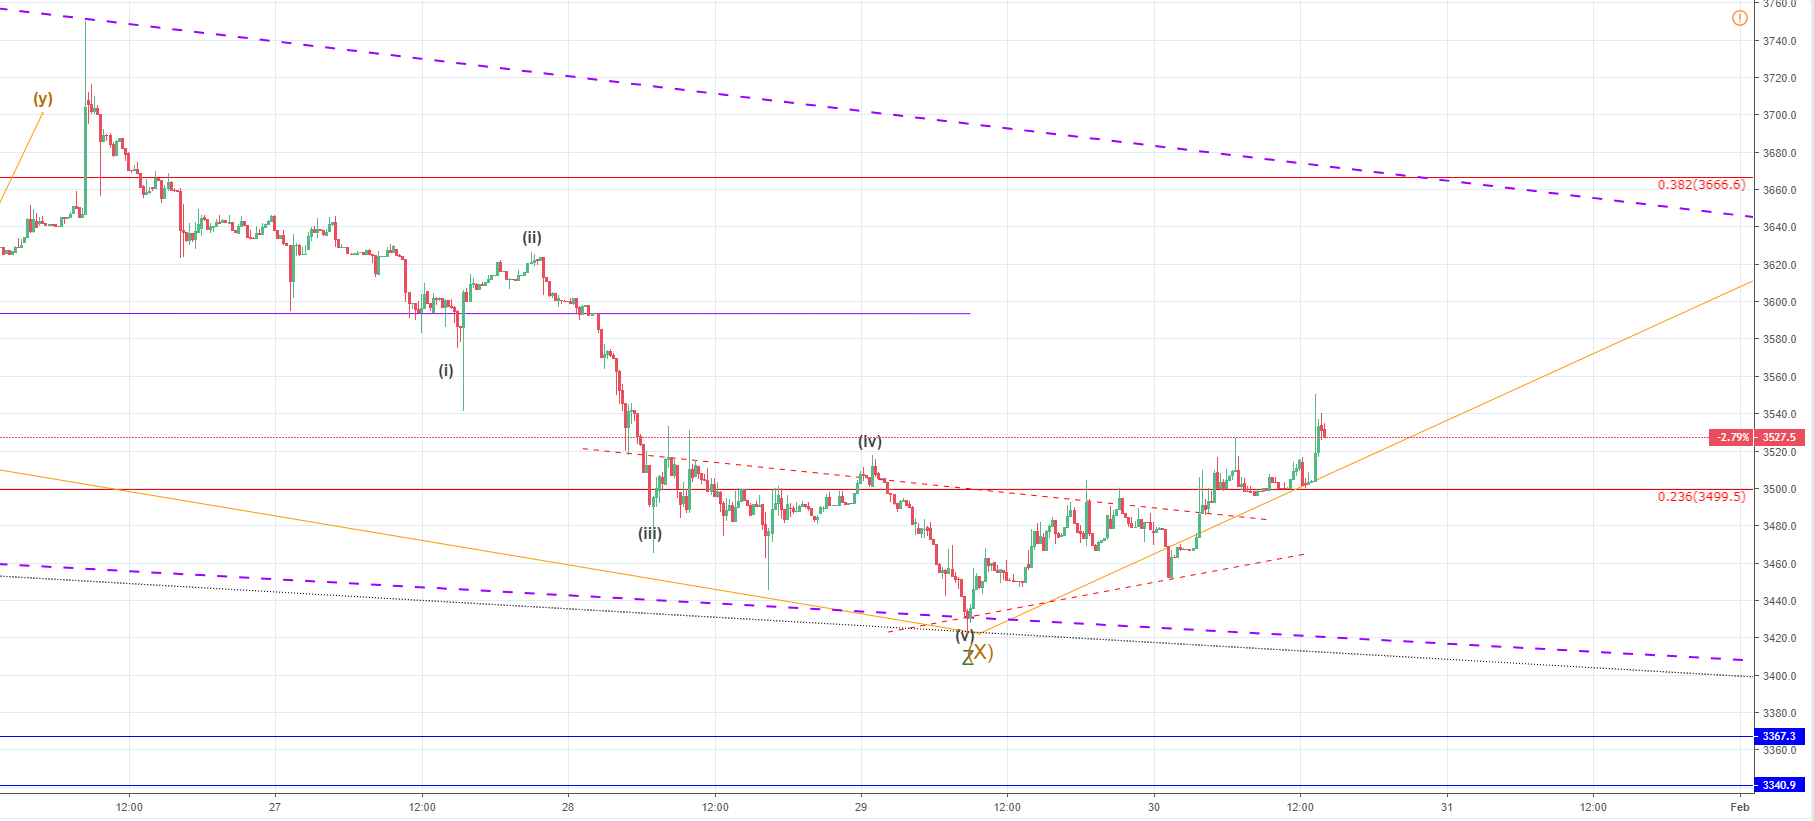
From yesterday’s open at $3508 the price of Bitcoin has fallen at first to $3430 and spiked even lower but managed to hold above it and since the spike down entered the buyers' territory, the buying has been activated.
This has led to a small recovery at first but the price caught some traction and the momentum increased which is why a breakout occurred from the triangle-like structure in which the price of Bitcoin was consolidating currently the price is at $3531 which is above the level of yesterday’s open making it higher high which indicates the start of an uptrend.
 Click to see the full-size image
Looking at the 15-min chart you can see that the price in an upward trajectory and is above the 0.236 Fibonacci level which was retested for support and has bounced off of it nicely, indicating that the support is there.
Since the price completed its 5th impulsive move and with it the Z wave from the WXYXZ correction we are now seeing the start of a reversal as the Minor correction was the X wave from a higher degree count out of which the Y wave is expected to develop to the upside.
If this is true then we are going to see a further increase and a breakout from the descending wedge on the upside as the Y wave would be an impulsive move like we have seen from 15th till 24th of December last year when the price of Bitcoin came up from $3233 to $4374.
The target price for the expected increase would be at around $4000 which was the horizontal support level now serving as resistance and the intersection with the descending resistance line previously the key support line since the bear market started.
Ethereum ETH/USD Price Analysis
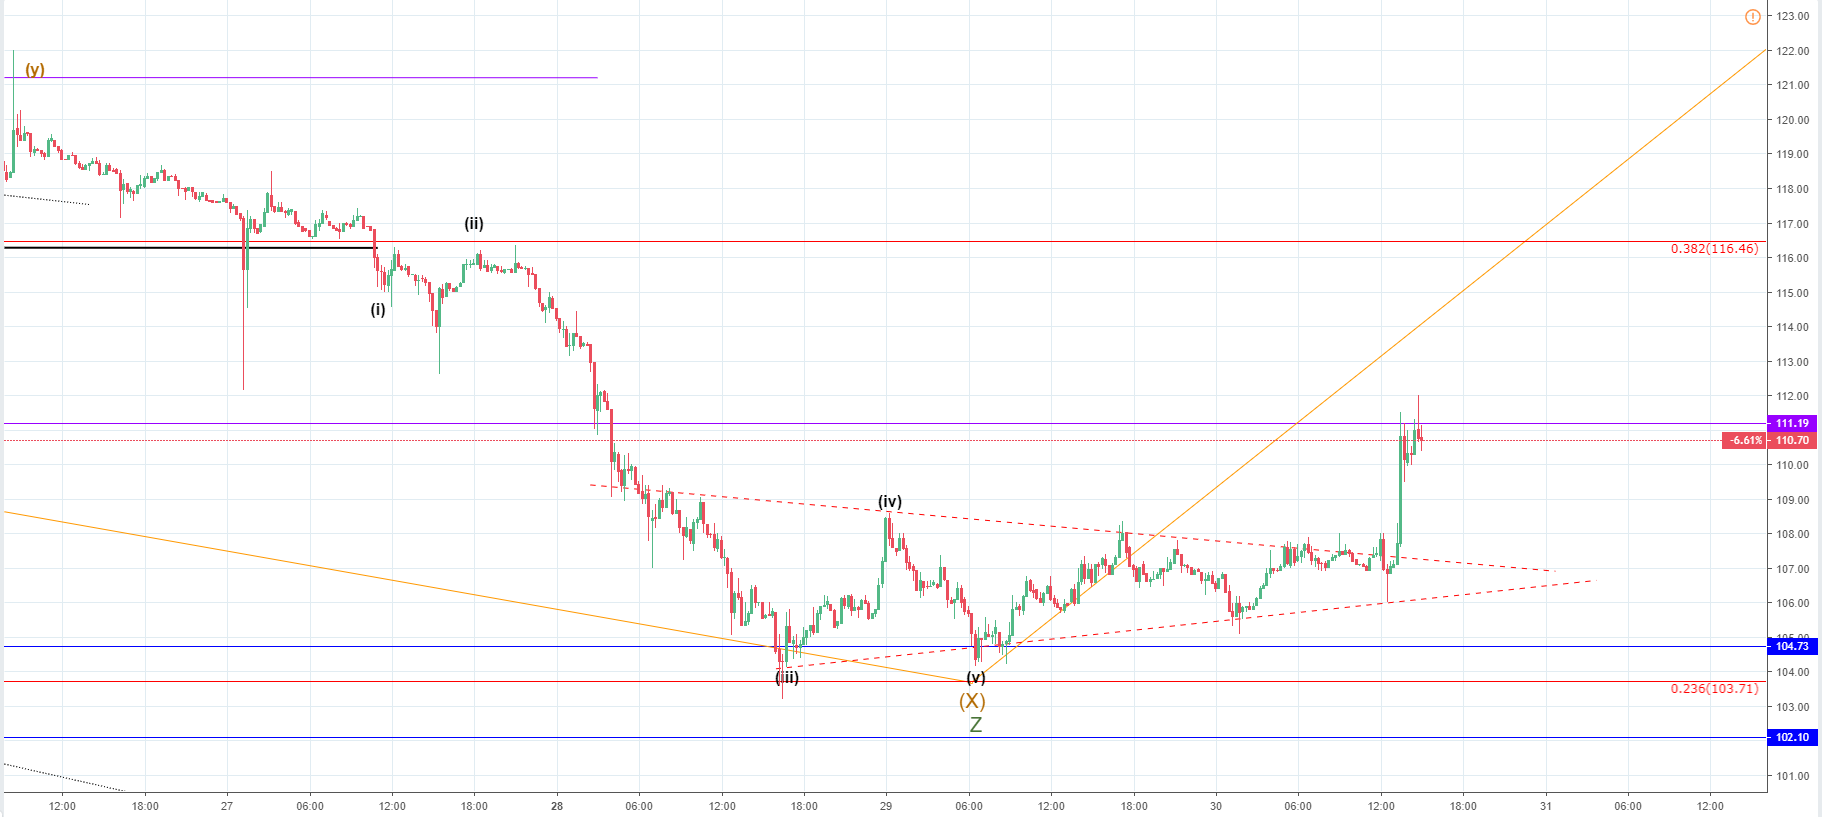
From yesterday’s low at $104.35 the price of Ethereum has increased by 6.08% as its currently being traded at $110.6.
 Click to see the full-size image
The price was consolidating after a downfall and the consolidation took place inside a symmetrical triangle, but since the 5th wave from the impulsive move to the downside a breakout to the upside was expected from here.
Strong momentum has been shown as the buyers have pushed the price to increase by 4.64% in the last couple of hours but the price encountered resistance at the $111.19 horizontal level. Considering that this is only a minor resistance point and on the other hand, the strong momentum that is shown, I believe that the price is going to go past the level and continue its upward trajectory to the 0.382 Fibonacci level at least before some minor correction will occur.
As the price has most likely ended its Minor WXYXZ correction which is the X wave from an intermediate count we are seeing the start of the Y wave to the upside. This wave would be impulsive although corrective in nature since the market is still indecisive.
If the Y wave started developing more momentum will be shown so this could serve as an indicator of whether or not the increase has started. But at the moment since the price of ETH has started gaining some traction I believe that it did.
XRP/USD Price Analysis
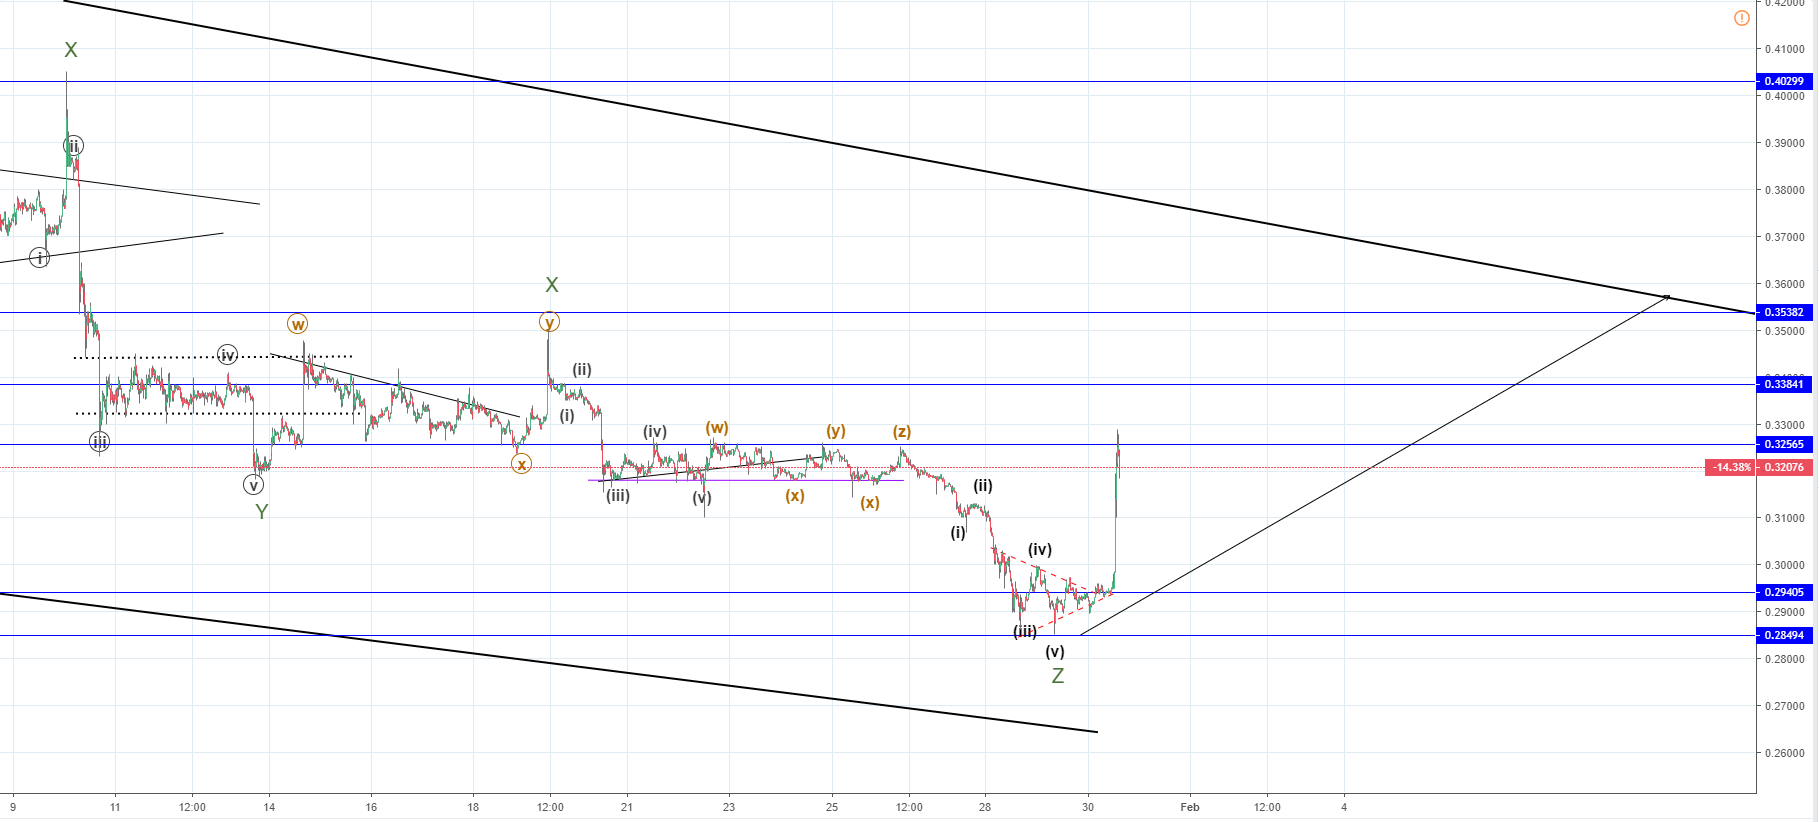
From yesterday’s low at $0.28770 the price of Ripple has increased by 12% measured to the current level on which the crypto is being traded which is at $0.32.
 Click to see the full-size image
On the 15 min chart, you can see that the price exponentially increased today, showing strong momentum which led to a breakout from the symmetrical triangle in which the price consolidated after the decrease has ended.
As the 5th wave to the downside developed we have likely seen the end of the Minor correction as the Z wave ended. If this is true then the current upward movement is the start of the intermediate wave Y which would push the price up impulsively.
Currently, the price is interacting with it first significant horizontal level which serves as resistance which is why now we could see the price pullback slightly before continuing its upward movement. I don’t expect that pullback to be a significant one but only a small stop before the trend continues.
The target price for the expected increase would be at the upper bold black line which is the resistance line from the descending channel in which the price of Ripple is from 21th of September.
Since this is the most significant resistance line and the price interacted with it 6 times so far, we are likely going to see another interaction. That would in price terms be around $0.35715 to $0.36 where the upper resistance level is from that resistance zone which was previously the support zone.
Bitcoin Cash BCH/USD Price Analysis
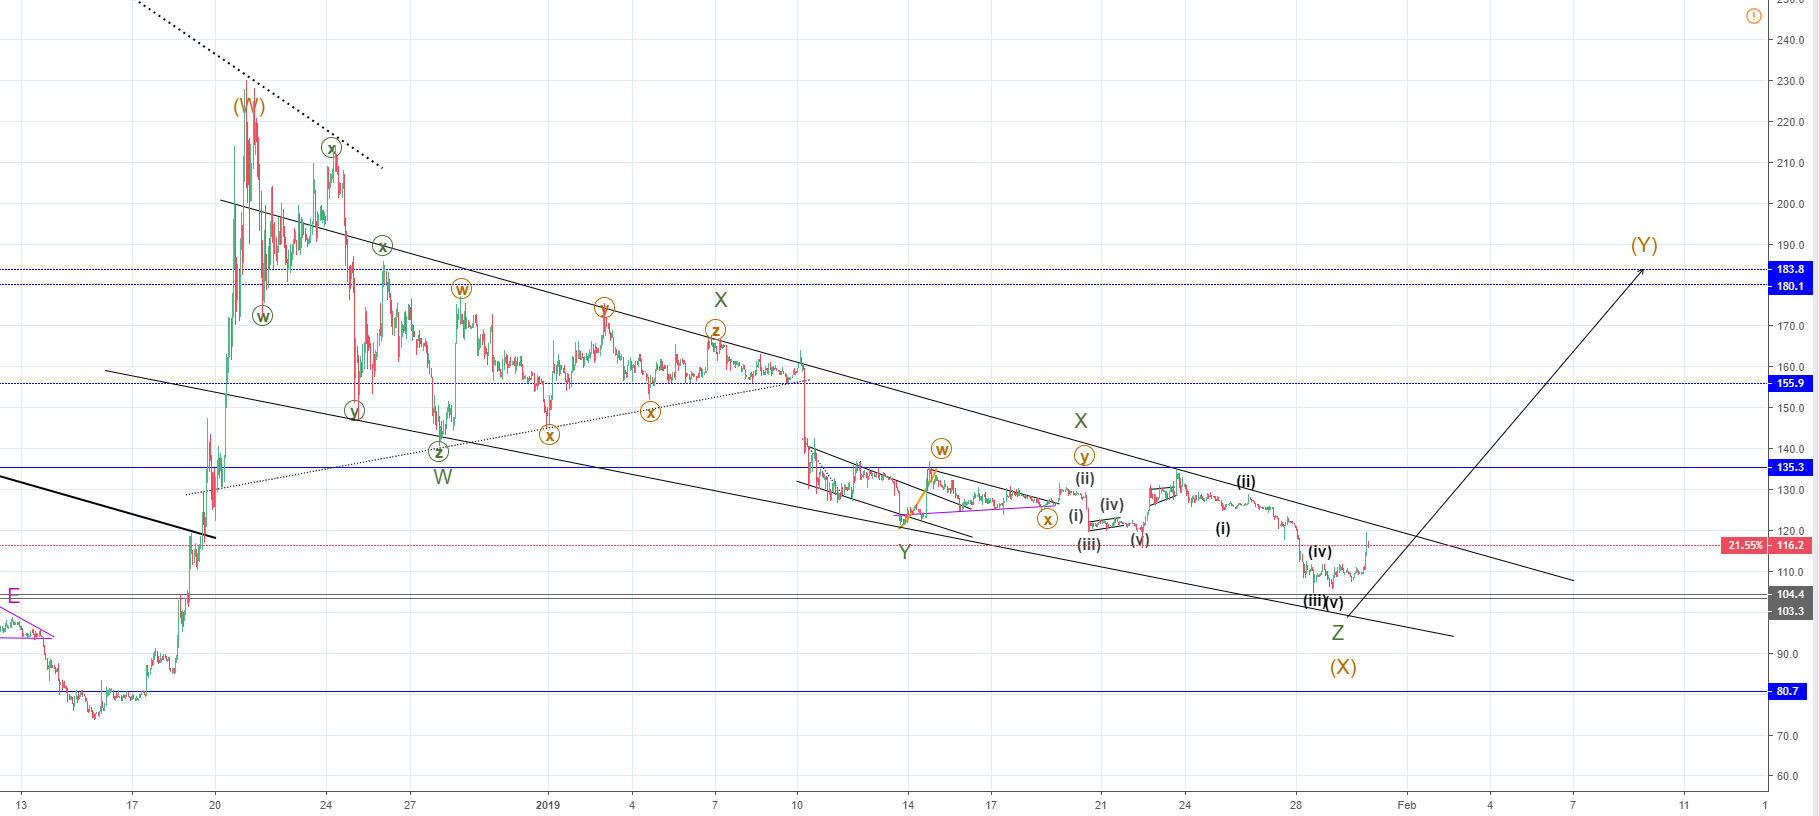
From yesterday’s low at $105.9 the price of Bitcoin Cash has increased by just over 10% as its currently being traded at around $116.2
 Click to see the full-size image
Looking at the hourly chart you can see that the price of Bitcoin Cash is in a descending channel from 24th of December like the other cryptos, and the descending channel was formed by the Minor WXYXZ correction that I referred to in the previous analysis but on this zoomed out chart you can see it more clearly.
As the Z wave most likely ended we are seeing the start of another upward move like from 15th till 24th of December and a breakout to the upside from the descending channel. Projecting the W wavelength on to the presumed Intermediate X wave ending point we come up with a target for the Y wave at around $183.
This would be the optimal target but I don’t believe that the price is heading up that far. More likely we can see the Y wave ending on the lower horizontal support level which now serves as resistance which is at $156.
Unlike in the case of Bitcoin where the price interacted with its descending structure’s support line on the Z wave, the price of Bitcoin Cash hasn’t. This may be due to the fact that the Z wave hasn’t ended and this applies to the other cryptos as well.
For now the Z wave has three waves- impulse, correction, impulse; and although it has most likely ended there is a possibility for an extension by two more Minuette waves in which case the current increase would be the first extension or the Minuetter second wave X after which we could see the final move to the downside which would be the second extension or the Minuette Z wave before the whole Minor correction ends and we see the start of the Intermediate Y wave.
This will soon be either validated or invalidated as the price has already come up, so now after the first pullback, we are going to see depending on the depth of a pullback. If the price pulls back to the levels of the yesterday’s low or even goes lower than this second scenario is in play and the Y wave hasn’t started.
But if the price pulls back to the levels of yesterday’s resistance point from where the price broke out and finds support there then the primary count in which the Y wave already started will be validated.
Current Crypto Market Outlook:
 Click to see the full-size image
Disclaimer: The author's analysis of the cryptocurrency market is not meant to be investment advice. Trade at your own risk.
Publication date
Disclaimer
The views and opinions expressed in this article are solely those of the authors and do not reflect the views of Bitcoin Insider. Every investment and trading move involves risk - this is especially true for cryptocurrencies given their volatility. We strongly advise our readers to conduct their own research when making a decision.