Latest news about Bitcoin and all cryptocurrencies. Your daily crypto news habit.
Bitcoin BTC/USD Price Analysis
From yesterday’s open at $3513 the price of Bitcoin has fallen by 2.9% at its lowest point to $3403 but was only a quick dip as the price came back above the intraday support at $3439. Since then the price has recovered slightly and is currently sitting at $3452 which is at the resistance line of the horizontal range in which the price is consolidating since yesterday’s downfall.
 Click above to see the full-size image.
Looking at the hourly chart you can see that the price has fallen to my projected levels but only with a spike and is now undergoing another correction to the upside which is the 4th wave for the last downward move and could come up to the vicinity of the 1th wave ending point at 0.382 Fibonacci level before continue moving down as the final, 5th wave should develop.
We could see the 5th wave ending on the 0 Fibonacci level at the prior low according to the Minuette count, but since the price hasn’t gone below the Minute 3rd wave I believe it will go lower.
In either way, a reversal is on the horizon as the ending point of the Minor Z wave looks closer to completion and it is the Intermediate count wave X which is why the Y wave is expected to launch the price impulsively up as we have seen in the period from 15th till 25th of December.
The target for the ending point of the Z wave would be optimally at $3340 which is the intersection with the falling wedge support line and the horizontal support zone, but it could end any time now as the moves are only getting smaller and smaller I wouldn’t come as a surprise if this happens tomorrow.
Ethereum ETH/USD Price Analysis
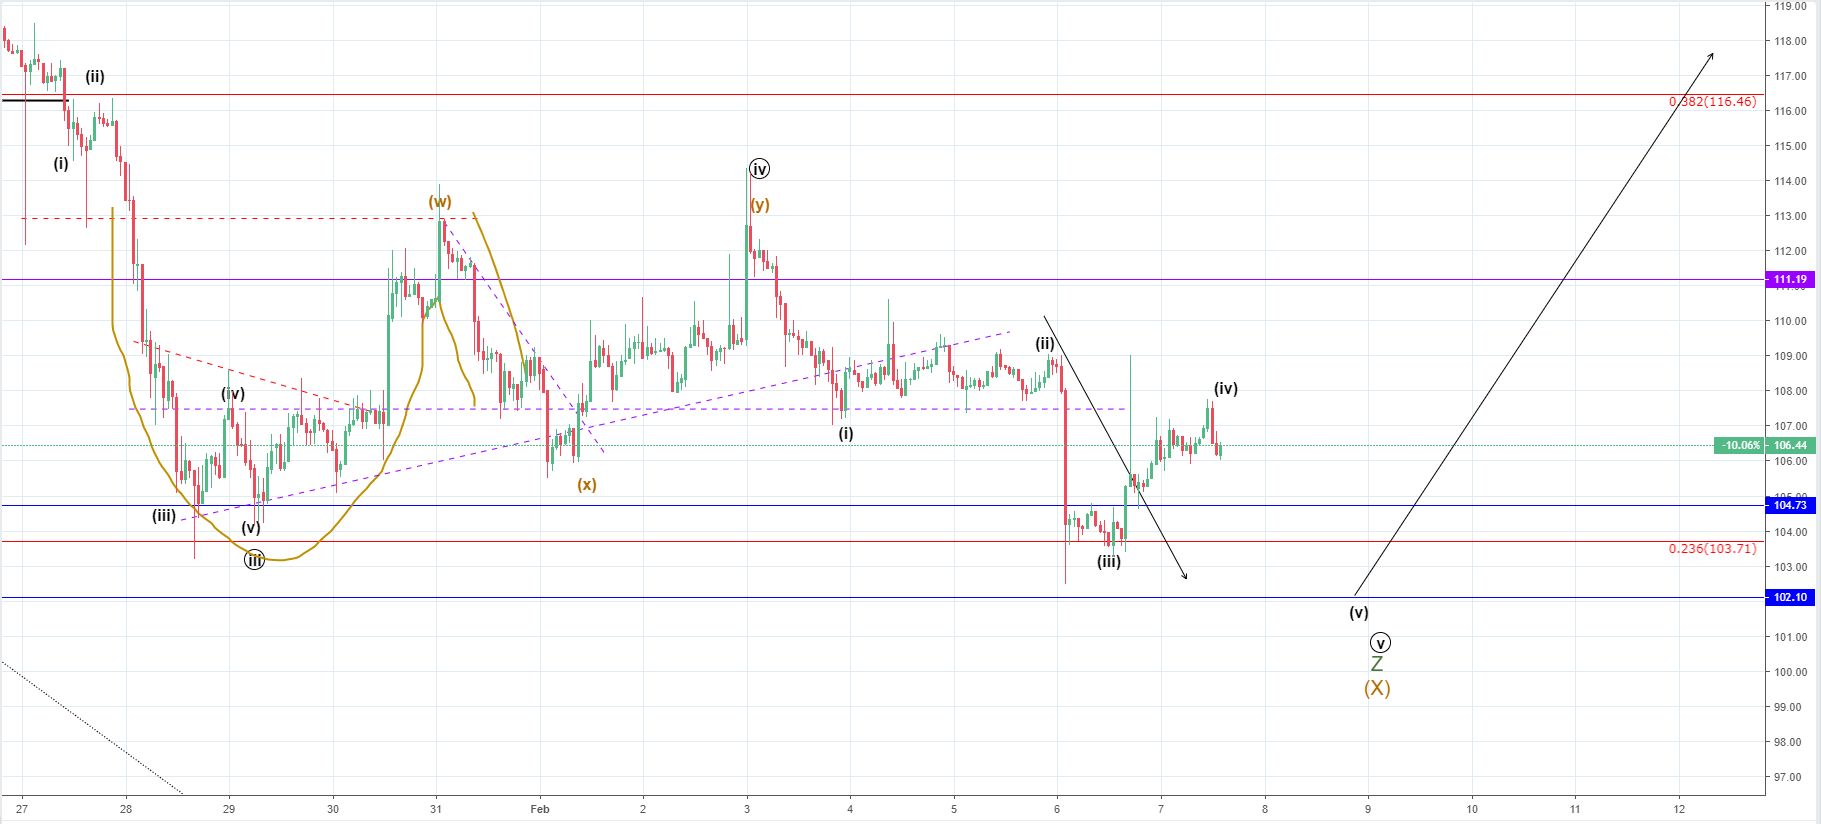
From yesterday’s open at $108.72 the price of Ethereum has fallen by 4.8% at first as it came down to $103.71 at its lowest point. Since the interaction with the 0.236 Fibonacci level, the price has started recovering and is now in an upward trajectory with the recovered 2.7% today as its currently sitting at $106.54.
 Click above to see the full-size image.
Looking at the hourly chart you can see that the price is still in its last stage with more move to the downside expected before a reversal as the now seen upward move was the 4th wave of a Minuette count which is the 5th impulsive wave of the Minute count and is the ending point of the Minor WXYXZ correction.
The price has interacted with the prior support at the 1st Minuette wave ending point and got rejected there which validates my count and is the reason I believe we are going to see another low before the expected reversal.
The expected price target would be at around $102 slightly below the prior low level. The price could end up at the 0.236 Fibonacci level as the 5th wave could end on the vicinity of the 3rd wave’s ending point especially if the move is bearish, in that way establishing support at one horizontal level.
After the last downward move, I would be expecting a reversal as the Minor WXYXZ correction is the X wave for an intermediate count and the Y wave to the upside should start developing. The target for the expected increase hasn’t been projected as it depends on various factors but if my Elliott Wave count is correct, we are going to see another impulsive move like the one until 24th of December.
XRP/USD Price Analysis
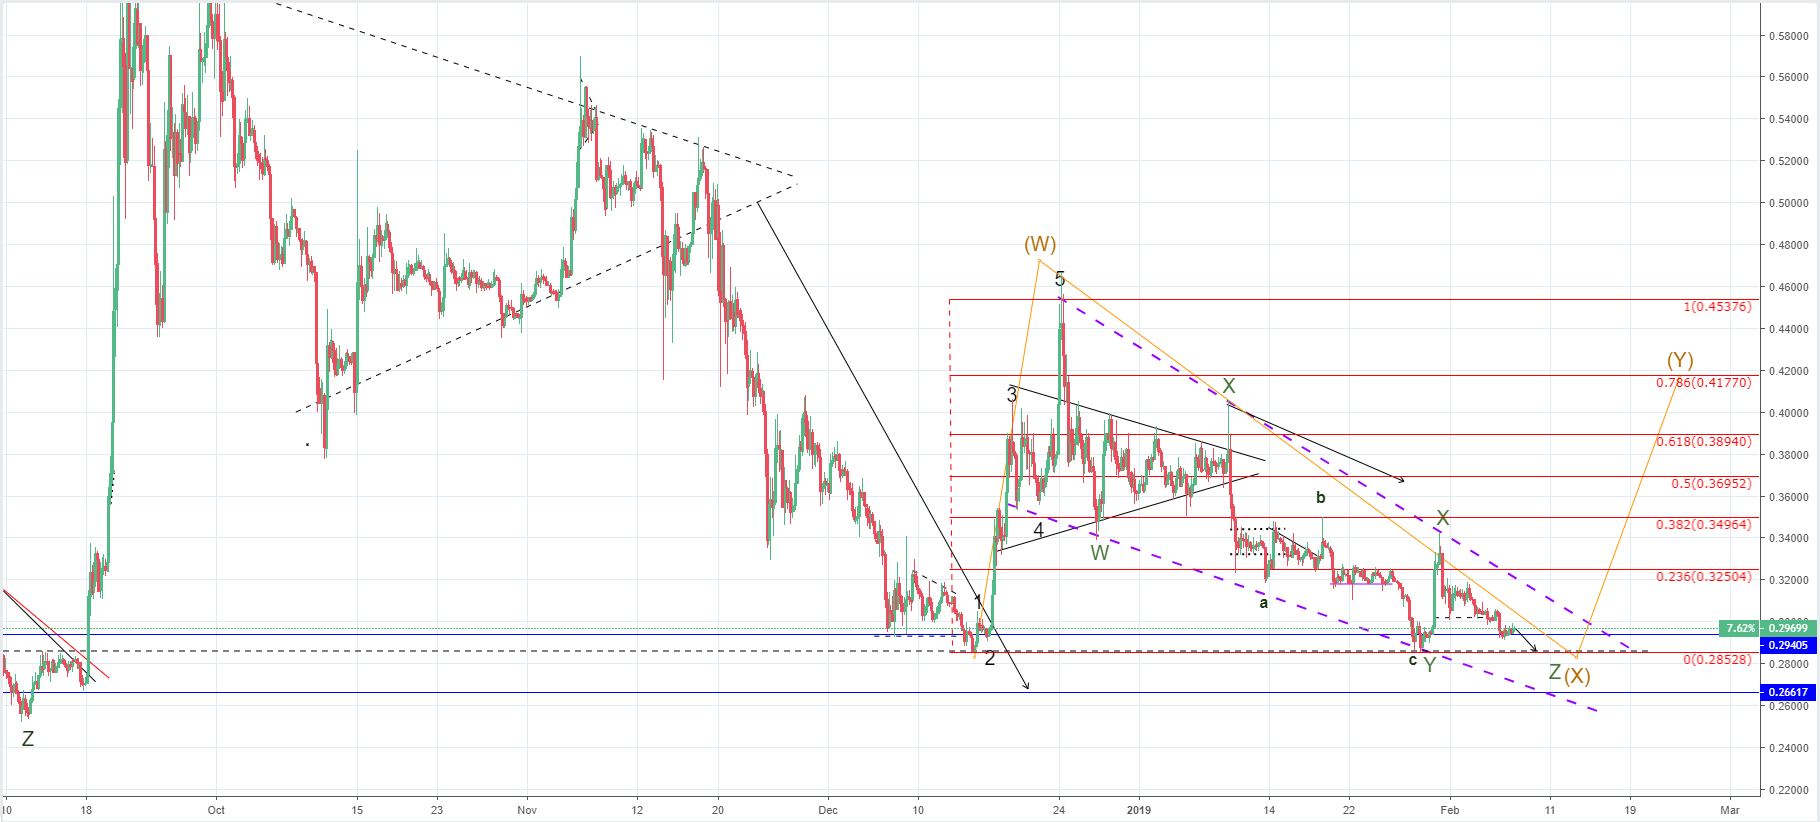
The price of Ripple hasn’t changed much in the last 24 hours as it was mostly been hovering around $0.296 with a small upward trajectory forming a minor ascending strcuture. It did fell from yesterday’s open at $0.303 to those levels which is why the range was formed as an indication of consolidation taking place after a downfall.
 Click above to see the full-size image.
Zooming out to the 4-hour chart you can see my expected scenario. Looking at the last structure you can see that the price of Ripple has at first increased exponentially until the 24th of December last year and was in a Minor WXYXZ correction like the other cryptos.
Now that the Minor correction looks near completion we are soon going to see a reversal as the Y wave to the upside should start developing but before we see that another low is most likely happening as the price has to establish firm support for an exponential increase that is expected once again.
I have deliberately zoomed out to the 4-hour chart so you can see the horizontal support levels on which I would be expecting that the Z wave ends on. The most optimal target would be at the prior low level where the 0 Fibonacci level is but we are yet to see how further could it go. The most pessimistic target would be at the next horizontal support level at $0.2661 which would be the most certain target as it would perfectly fit the interaction with the falling wedge support line with the ending point of the correction that has led to its creation.
EOS/USD Price Analysis
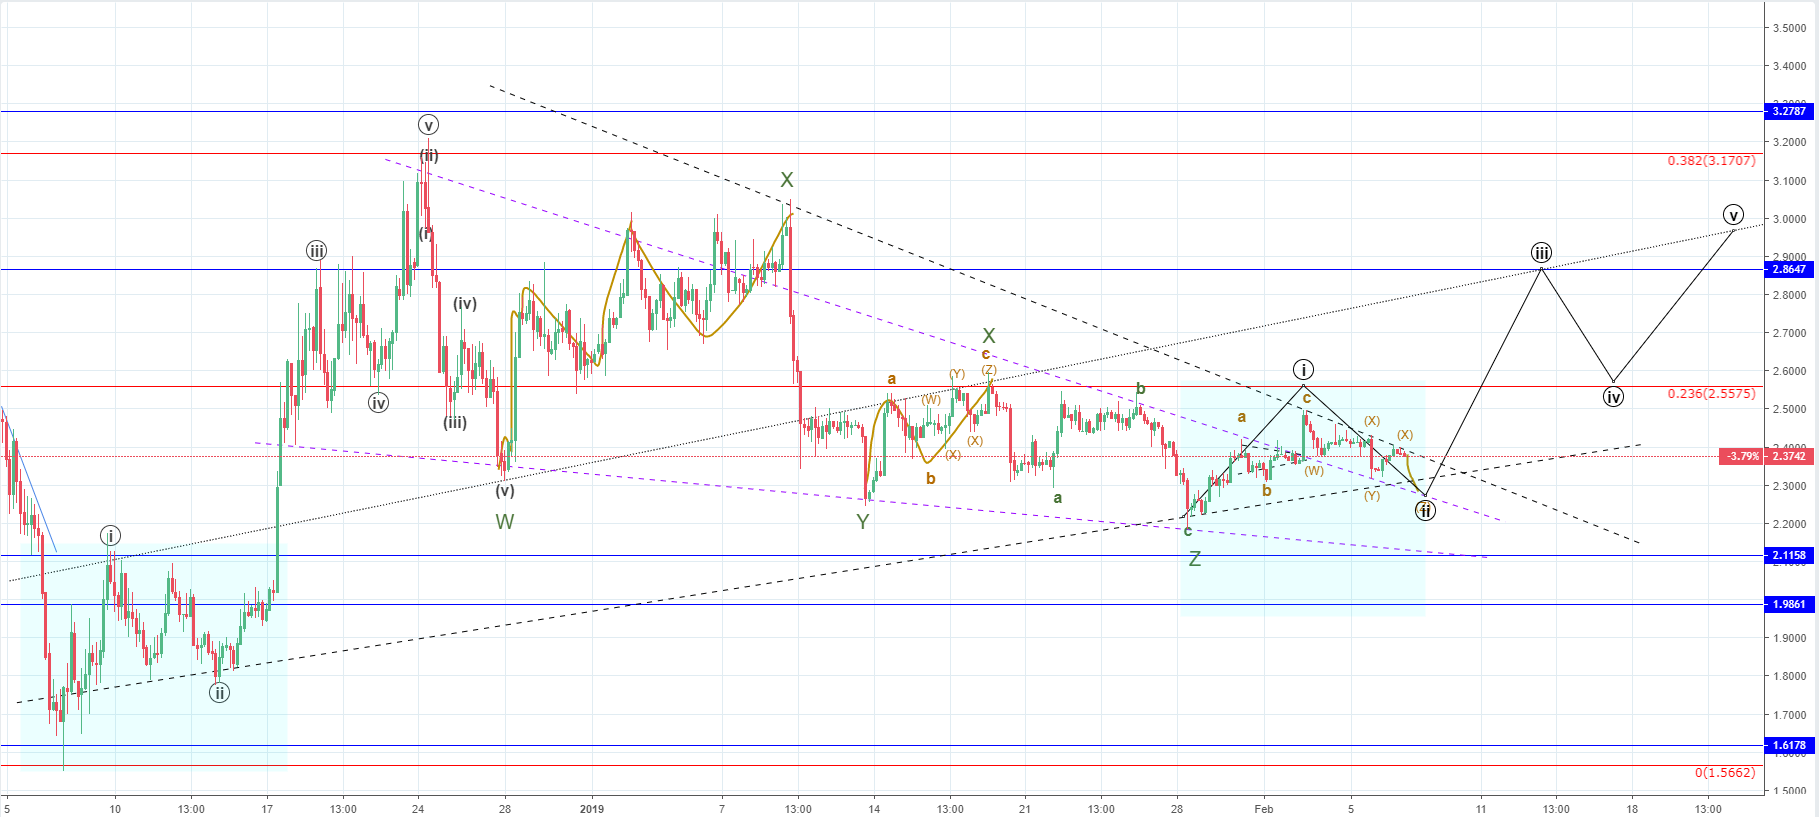
From yesterday's open at $2.42 the price of EOS has fallen at first in the same manner like the other cryptos and that by only 3.54% to its lowest point at $2.33 which was it’s intraday support from where an increase has been made which led the price to the current levels of at around $2.3742.
 Click above to see the full-size image.
Looking at the EOS 4-hour chart you can see that there is a possibility that in its case the impulsive move to the upside has begun as the Minor correction ended on the Z wave slightly lower than the Y wave and in a three-wave manner.
It's hard to say if the increase that we have seen from 29th is the first impulsive move to the upside from the Y wave of an Intermediate count that is awaited to begin in the case of other cryptos but from here I would definitely be expecting a retracement back to the established uptrend support line which was confirmed by the Z wave.
The uptrend support line intersects the falling wedge resistance which was broken on 3rd as a retracement back to those levels for confirmation of support would be the next logical step if the price want’s to continue its upward trajectory so the scenario will pretty much be validated if it does.
If the price manages to get inside the falling wedge territory then there would be a possibility that the Minor correction hasn’t ended and that we have seen a prolongation of the final wave Z.
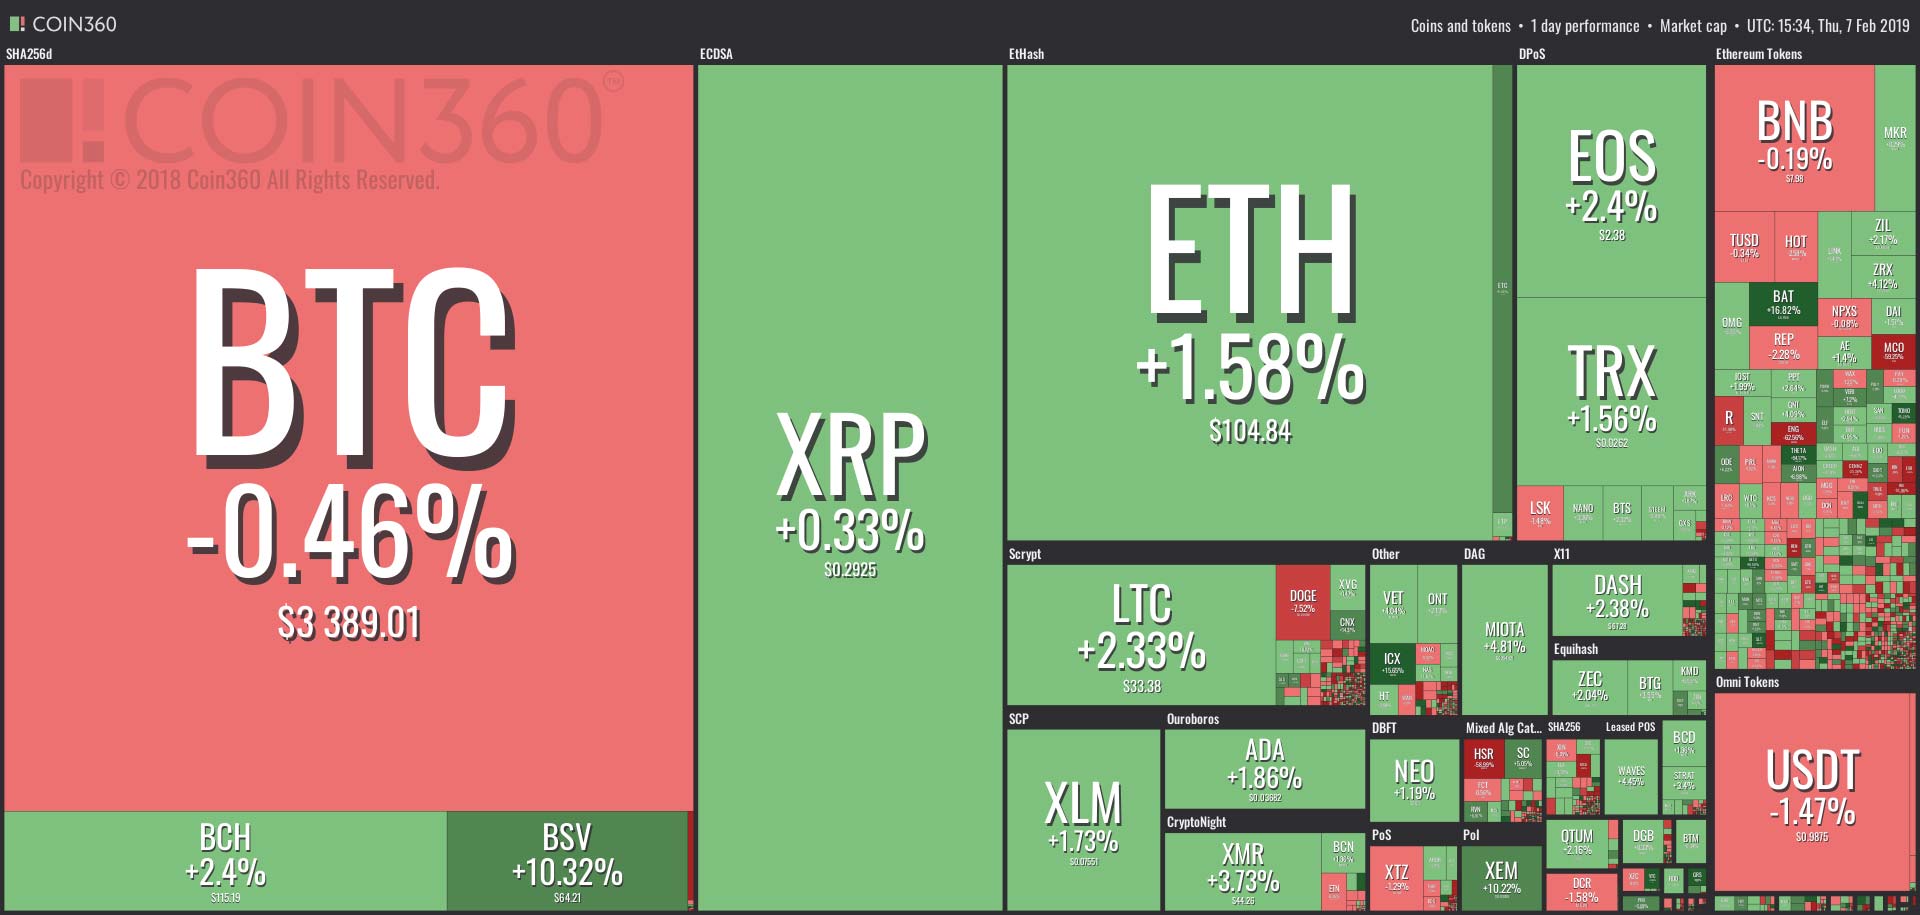
Crypto Market Update:
 Click above to see the full-size image.
Disclaimer: Analysis is not meant to be investment advice. DYOR – Do Your Own Research.
Publication date
Disclaimer
The views and opinions expressed in this article are solely those of the authors and do not reflect the views of Bitcoin Insider. Every investment and trading move involves risk - this is especially true for cryptocurrencies given their volatility. We strongly advise our readers to conduct their own research when making a decision.