Latest news about Bitcoin and all cryptocurrencies. Your daily crypto news habit.
Bitcoin BTC/USD
Bitcoin has been mostly hovering around the same levels from yesterday with a slight downward trajectory and is now 1.65% lower than on yesterday’s open at $3734 as its currently being traded at $3684
 Click to see the full-size image.
Looking at the hourly chart you can see that the price has encountered some significant resistance at the descending trendline (purple) which is the upper resistance line from the descending channel in which the price of Bitcoin was correcting from 24th of December.
The price is still above the 0.328 Fibonacci level which is a good sign but today we have seen it go slightly below it, as the interaction has been made with the support line of the descending triangle in which this minor retracement occurred, and since the price found support there it bounced to the upside again which indicates that buyers are very much present.
Considering that the price grew exponentially on Friday and increased by more than 10% in a matter of hours we can say that the momentum behind the increase was strong but as the current resistance level are also we are yet to see if the uptrend continuation occurs or are we are going to see further retracement before a trend continuation.
If we are to see further retracement the most optimal target would be at the prior horizontal support level at $3555 with is the resistance of the prior range now serving as support and would be 3% lower than the current levels.
But if we are to see a trend continuation I would be expecting to see immediate momentum to the upside followed by a breakout from the descending channel in which the price is correcting.
These two expected scenarios are in line with my primary count in which the Minor WXYXZ correction ended and we are seeing the start of the next impulsive move to the upside.
If this, however, hasn’t happened the price of Bitcoin is headed for another lower low compared to the previous one at around $3430 which would be the last wave Z and the current increase would be the second wave X.
Ethereum ETH/USD
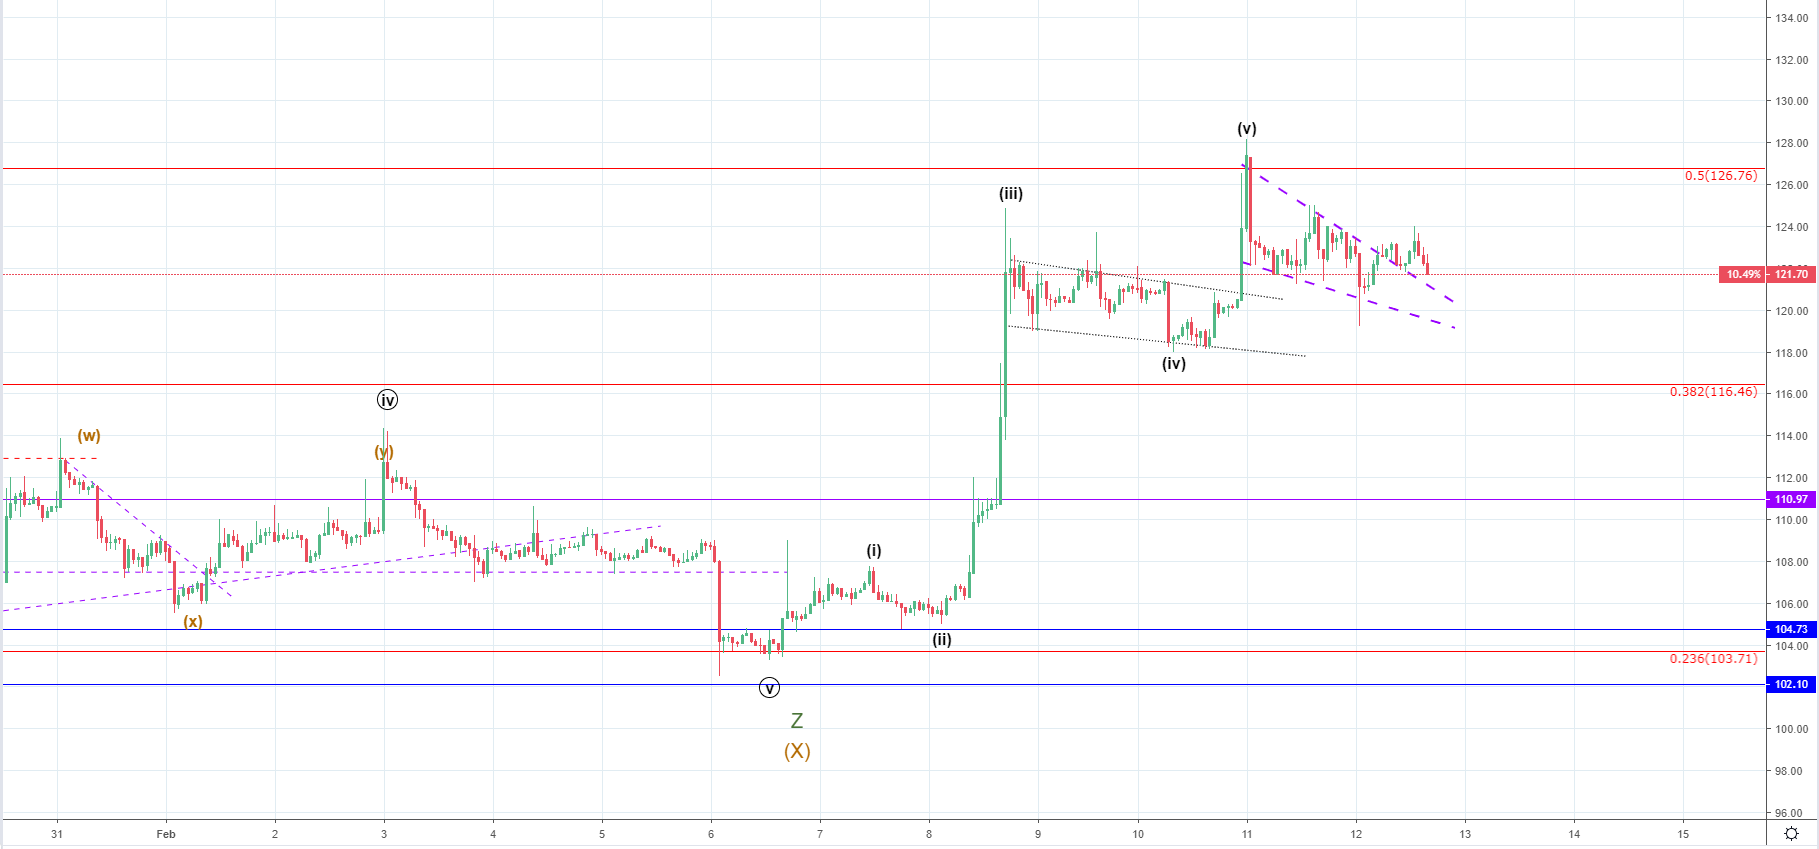
The price of Ethereum has been correcting inside a falling wedge from yesterday’s open at $127.3 and has lost 4.43% until now as the crypto is being traded at $121.7 at the moment.
 Click to see the full-size image.
On the hourly chart, you can see that the price broke out from the falling wedge today and has now come down to its support line and the horizontal resistance of the previous range for a retest of support.
If the support is present we could expect to see further increase above the 0.5 Fibonacci level but as the wave structure implies we are likely now going to see further retracement as the 5 waves impulsive move the upside ended.
The expected retracement would be the second wave of a higher degree impulse so I wouldn't expect it to go more than 70% from the last high which would bring the price target for the retracement to around $111 area where the horizontal purple line is.
Like in the case of Bitcoin this expectation is based on the count in which we are seeing the start of the second impulsive move after the Minor correction ended, so if the price continues moving lower than that would mean that the current upswing was a prolongation of the Minor correction and that another low should be expected before the start of another impulsive move.
Ripple XRP/USD
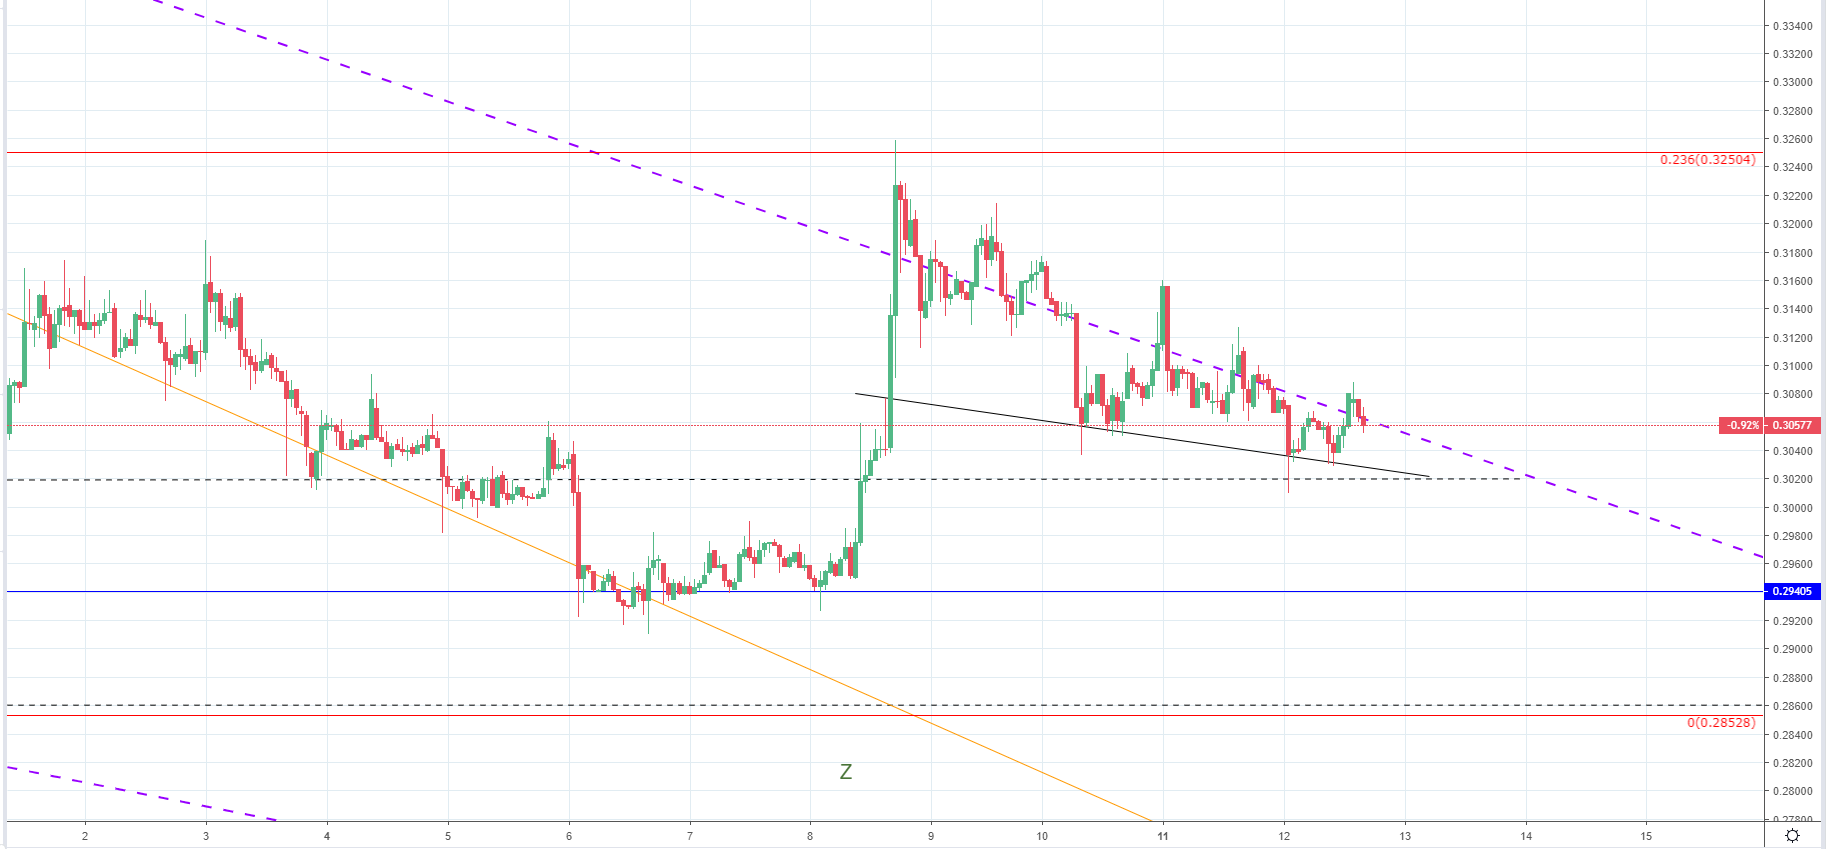
From yesterday’s open at $0.31578 the price of Ripple has decreased by 3.13% as its currently being traded at $0.30578. The price hasn’t fallen in a line as it is in the minor falling wedge in which it has been moving sideways but slightly to the downside.
 Click to see the full-size image.
As you can see from the hourly chart the minor falling wedge resistance is the same resistance line from the falling wedge of a higher degree and the price action is currently creating a cluster around those levels indicating strong resistance from one side and a buying pressure from the other.
Friday’s momentum has been strong but we just might be seeing it getting extinguished as the price increase has been stopped out around the resistance are from the 0.236 Fibo level as well as the falling wedge resistance line.
If this increase was the start of the impulsive move after the Z wave ended we are now going to see a breakout to the upside from the current minor wedge but if this was the end of the second wave X than the current minor falling wedge is the start of the Z wave and a range in which the sellers will gain control.
As the price found support on the minor falling wedge support line and the prior range horizontal resistance level now serving as support, if we are seeing the start of the second Intermediate impulsive move an immediate breakout to the upside should occur, but if now the price is headed for a lower low compared to the previous one at $0.294.
Bitcoin Cash BCH/USD
From yesterday’s open at $126 the price of Bitcoin Cash has declined by 5.25% measured to the current level at $119.5.
 Click to see the full-size image.
On the hourly chart, you can see that the price has encountered resistance at the descending channel resistance line and has been in a retracement from Friday’s increase. The price is currently in a downward trajectory so the further decrease is expected today and if my count is valid the price isn’t going past the outlined horizontal level at $117.6 which is the ending point of the first impulse wave.
If it does go below it, that would only mean that what we are seeing isn’t the start of the impulsive move but yet another Minute correction out of the Minor WXYXZ. But as my count implies we are most likely seeing the development of the third Minor impulsive wave that is set to break out from the current descending structure and is headed further up.
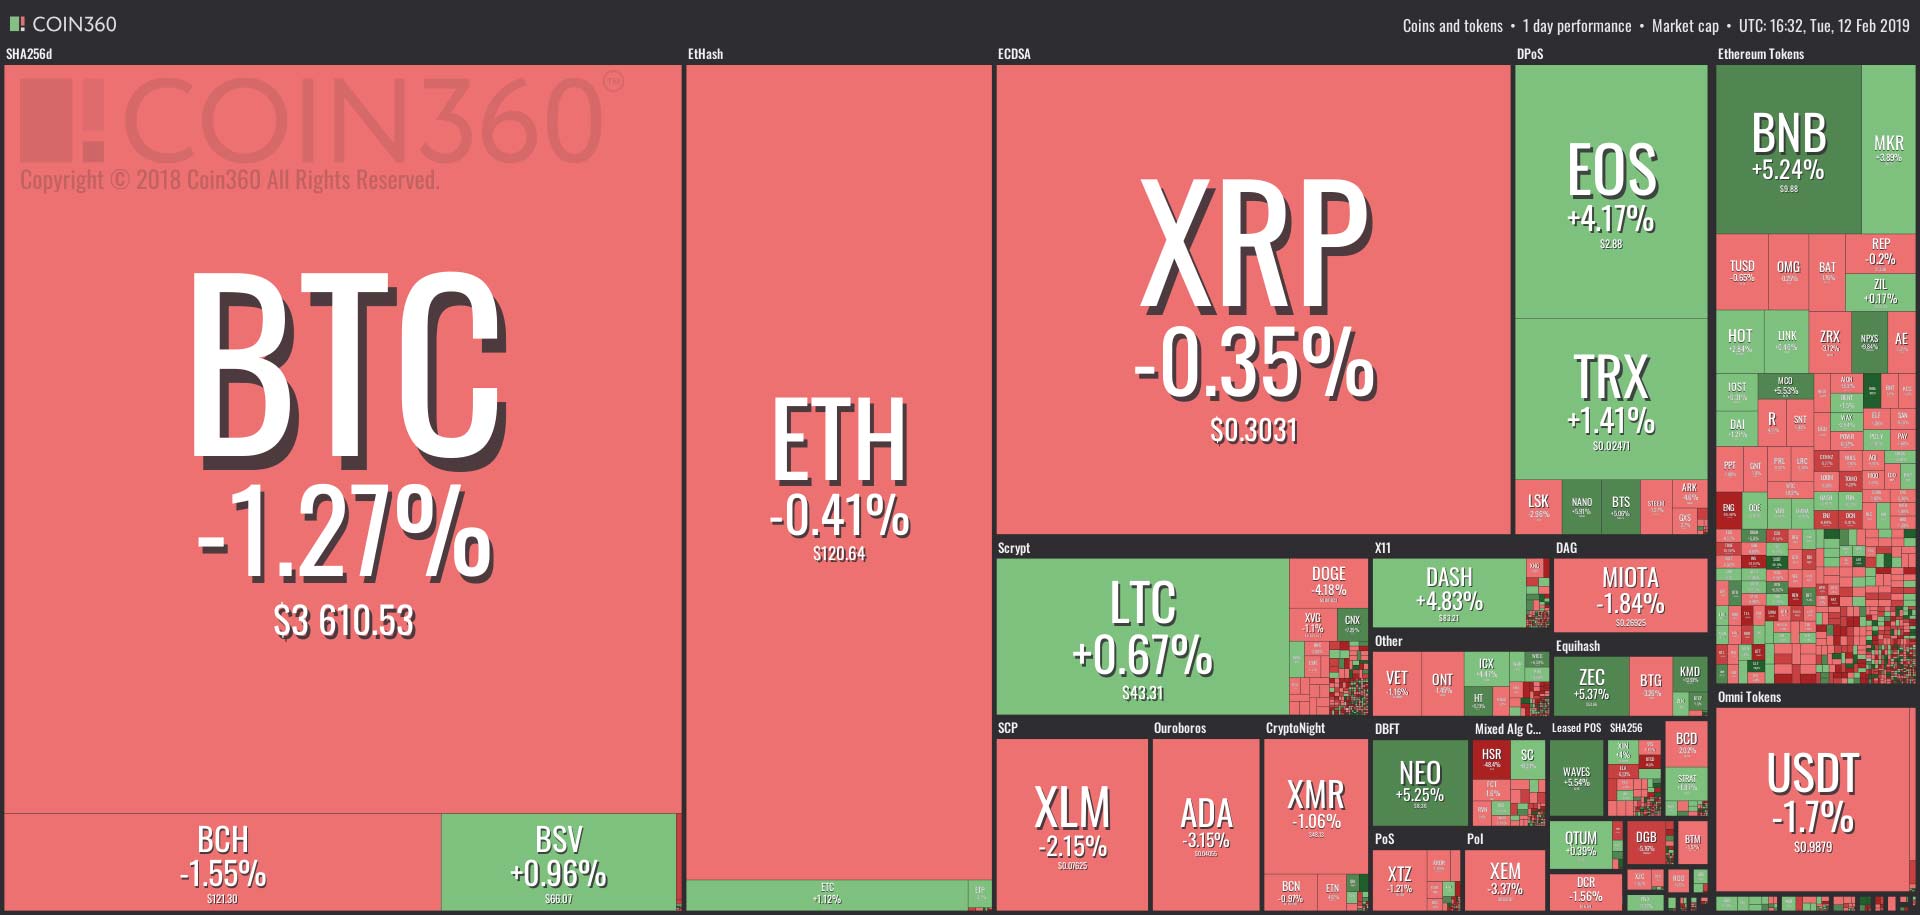
Current Crypto Market Overview:
 Click to see the full-size image.
Disclaimer: Author's analysis isn't meant to be investment advice. Trade and invest at your own risk.
Publication date
Disclaimer
The views and opinions expressed in this article are solely those of the authors and do not reflect the views of Bitcoin Insider. Every investment and trading move involves risk - this is especially true for cryptocurrencies given their volatility. We strongly advise our readers to conduct their own research when making a decision.