Latest news about Bitcoin and all cryptocurrencies. Your daily crypto news habit.
In this part of the data visualization project, we will review charts that help find similarities and differences between various categories of data and discuss their purposes and specifics.
But firstly, let’s sort out what a discrete data is.
What is discrete data?
Data is discrete if you can answer affirmatively on the following questions about it:
- Is it countable?
- Is it possible to divide the data into smaller parts? (i.e., to categorize it)
Discrete data can contain only a finite number of values. One of its notable properties is that, unlike continuous data, it can’t be measured, only counted.
Examples of discrete data: the number of players in a team, the number of planets in the Solar System.Examples of non-discrete (continuous) data: height, weight, length, income, temperature.
Bar chart
The simplest and the most popular type of chart. It displays grouped data using rectangular bars with lengths that are proportional to the values. Bar charts are broadly used in marketing and finance.
Purpose
Use it to compare data points that are spread across categories with each other.
Pros
- Makes data more readable if the categories have long names or if you have more than 10 categories
Recommendation
- Arrange bars on the chart in a logical ordering: ascending or descending one
Examples and variations
- A single-series chart in which the values are compared inside one category.
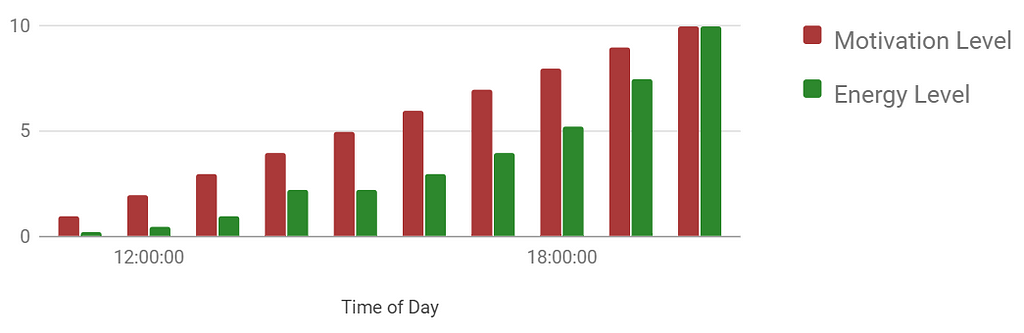
- This is an example of a clustered (grouped) bar chart. Use it for comparing multiple series inside the same category.
 Stacked bar chart
A stacked bar chart is composed of multiple bar series stacked horizontally one after the other. This modification of the bar chart makes it easier to track the variation in the individual values and their total value.
Purpose
Use it if you are interested in the proportional contributions either of categories to the total or of values within each category.
Pros
- If designed wisely, this type of chart is the best option for comparing multiple categories by measuring the bar lengths
Recommendation
- Limit the chart to six-seven series, otherwise, a chart will be cluttered and difficult to interpret
Example
 Column chart
It’s constructed the same way as a bar chart but with a vertical axis for categories and a horizontal — for their values.
Purpose
It helps track changes in values over time by comparing total column lengths.
Pros
- Highly readable when comparing values between a small number of categories (less than 12)
Recommendation
- In case your dataset has negative values, use the column chart instead of the bar chart as the negative values are associated with a downward direction
Examples and variations
- A single-series column chart:
- Clustered (grouped) column chart:
 Stacked column chart
A stacked column chart is composed of multiple column data series stacked on top of one another.
Purpose
The stacked column chart is designed to compare totals and notice changes at the item level that are likely to have the most impact on changes in totals.
Pros
- Best for part-to-whole comparisons over time or across categories.
- It helps to get an understanding of the integral picture in a quick glance without a focus on the details.
Examples
 Bullet chart
A bullet chart is a modification of a bar chart adapted by modern business needs. It can be displayed both vertical and horizontal. The chart consists of a target marker that represents the target value, an achievement bar that represents the current value of a metric and a comparison range.
Purpose
It was designed by Stephen Few for tracking progress toward a goal and measuring how far you are from the target.
Pros
- It removes the necessity to use circular/linear gauges and meters on a dashboard
Recommendation
- Use custom background colors to encode the interpretation of values that lie within the comparison range
Example
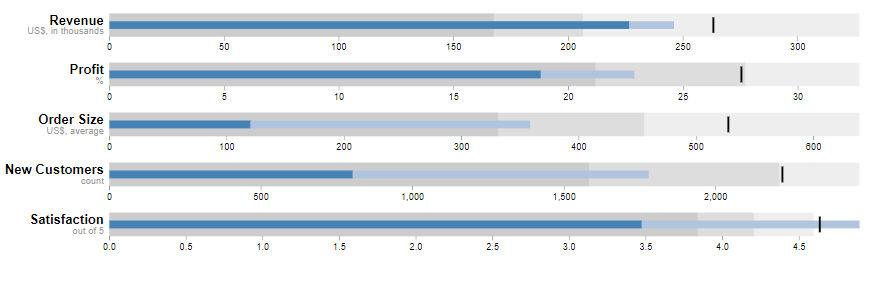
Usual meaning: the lighter the background, the better the result. However, in the case of “Expenses”, according to its negative sense, you can reverse the quantitative scale.
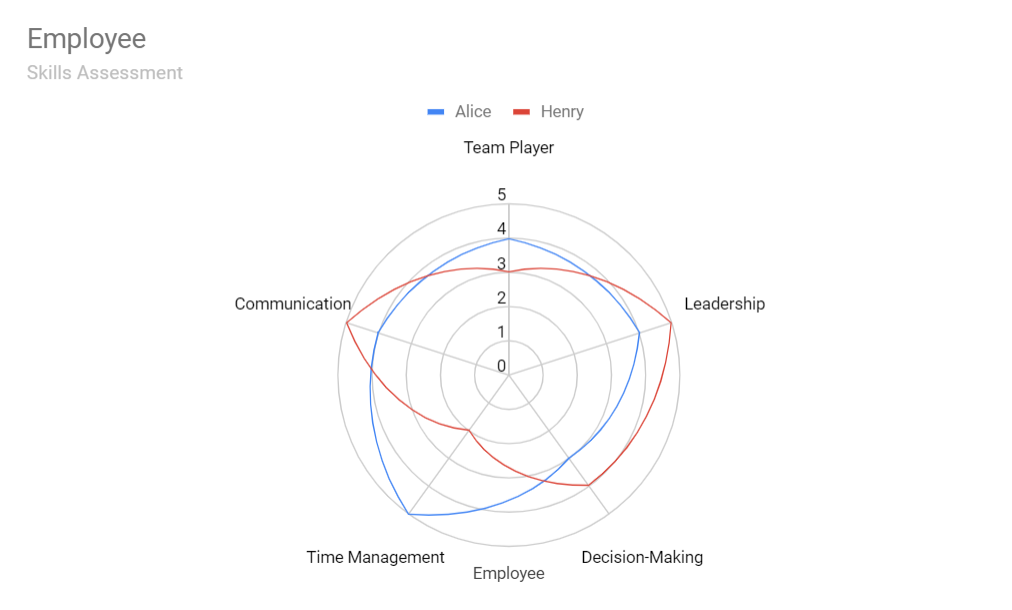
Spider chart
In this chart, each variable’s axis starts from the center point. Axes are arranged radially around it. The value is presented by an anchor on the axis. This data point is connected with the axis by a line. It’s the process of plotting a polygon. As you may notice, it reminds a spider web; hence the name. Equivalent names are ‘polar chart’, ‘web chat’, ‘radar chart’, and ‘star plot’.
Purpose
It’s designed for comparing multivariate data that has three or more quantitative variables.
Pros
- Works best for comparing products by highlighting their strengths (features) and weaknesses
Recommendations
- Use color coding and labels to distinguish multiple items when comparing them.
- Don’t be misled by the area of the polygons: it is increased by the squares of values. Thus, one may think that tiny changes are more important than they really are.
- Take into account that the area and the shape of the polygons may vary significantly depending on the position of axes.
Examples
 Summary
We truly hope this overview will help you decide which charts are best suited for your data and get a general idea about how you can compare discrete groups of data graphically.
Stay tuned for further updates!
Useful links
- Recommendations on how to use the charts in your presentation
- How to use WebDataRocks Pivot Table with Google Charts
Demos
Originally published at www.webdatarocks.com.
Best Charts to Show Discrete Data was originally published in Hacker Noon on Medium, where people are continuing the conversation by highlighting and responding to this story.
Publication date
Disclaimer
The views and opinions expressed in this article are solely those of the authors and do not reflect the views of Bitcoin Insider. Every investment and trading move involves risk - this is especially true for cryptocurrencies given their volatility. We strongly advise our readers to conduct their own research when making a decision.