Latest news about Bitcoin and all cryptocurrencies. Your daily crypto news habit.
Bitcoin BTC/USD
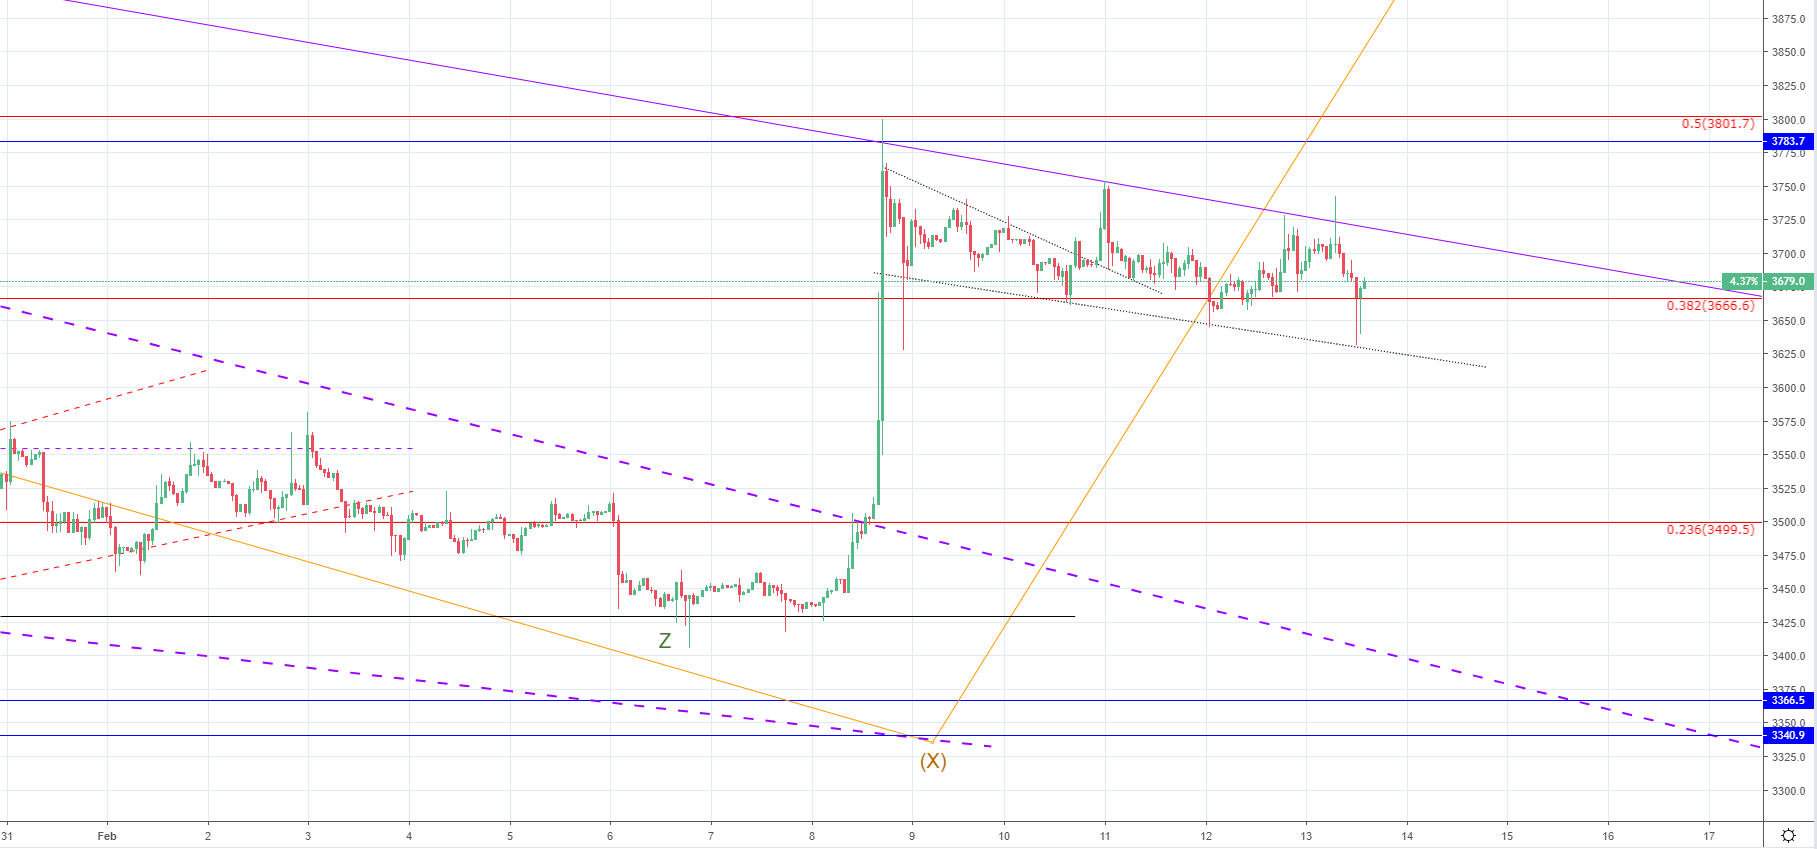
From yesterday’s open when the price of Bitcoin was $3688 at the open the price hasn’t changed much as its only 0.26% lower and is sitting at $3679.
 Click to see the full-size image.
Looking at the hourly chart, we can see that the price has fallen today for interaction with the minor descending channel support line but it was only a quick spike as the price immediately came up above the 0.382 Fibonacci level.
As the price is still inside the descending range we are still seeing a struggle between buyers and the sellers so a breakout is soon to be expected but the direction of a breakout is still unclear.
Considering the context – the price has increased previously with strong momentum and is currently hovering below the descending channel’s resistance (purple line) which mean that the buyers are still putting pressure, a breakout to the upside looks more likely.
Looking at the wave structure inside the current descending range I see two consecutive corrections – one to the downside and one to the upside which was ended, so if another correction develops of the same degree it would be the third correction to the downside after which a breakout to the upside should occur, but there isn’t any more sideways movement inside the mentioned range we are immediately to see the start of move to the downside as the correction to the upside ended.
Ethereum ETH/USD
From yesterday’s open at around $123 the price of Ethereum has fallen at first to $121 area but has started increasing afterward and came up to $127.45 at its highest point today and spiked a bit further up but the hourly candle closed on those levels which are in the vicinity of the prior high at the 0.5 Fibonacci retracement level which serves as strong resistance.
 Click to see the full-size image.
On the hourly chart, we can see that the impulsive move to the upside has ended as I have counted 5 waves so what we are currently seeing is most likely a correction which would end as a regular flat correction as the X wave came up to the exact same levels as the last impulsive move so the Y wave would be ending on the vicinity first W wave ending point which is in price terms at around $120.8.
The X wave to the upside has 5 waves and looks impulsive which is a similar pattern that we have seen from the start of the Minor WXYXZ correction that started on 24th of December so if we are to see a similar structure developing there is going to be so further sideways movement in a correction to the downside like the Minor correction was.
Since the momentum behind the Friday’s increase was strong the price is still putting pressure on the 0.5 Fibonacci level but the resistance proves to be significantly stronger since it hasn’t made any progress moving beyond it and considering the momentum it shouldn’t have been a problem.
The price is showing first signs of weakness so a further pullback is now most likely either as a pullback before another runup or a downfall altogether.
Ripple XRP/USD
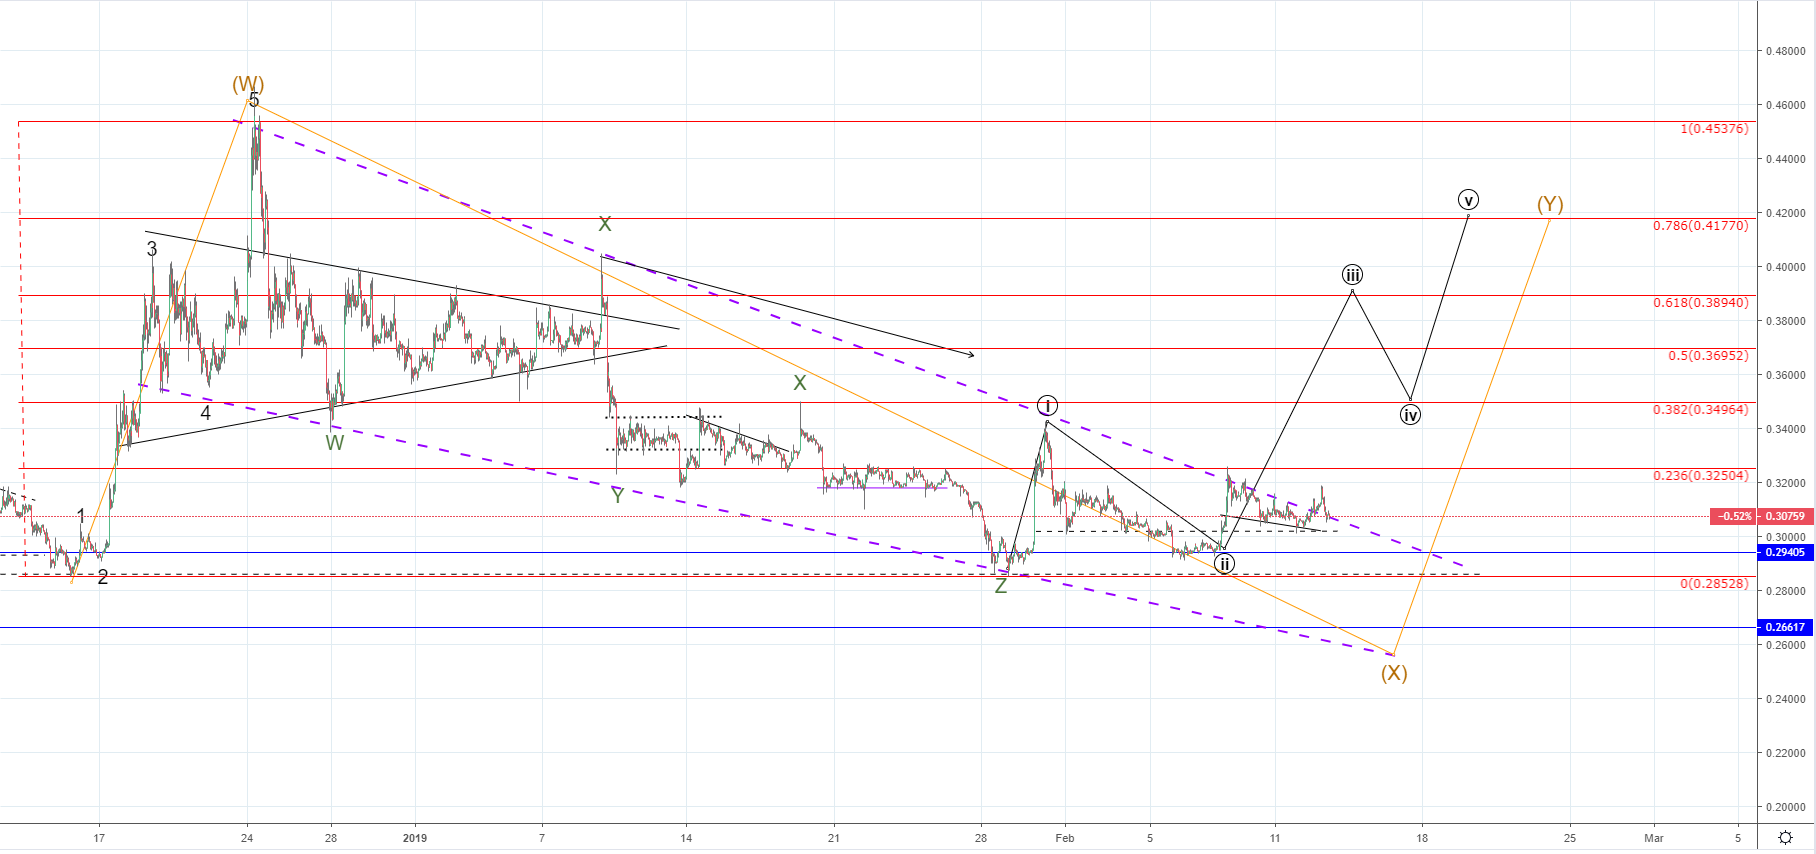
From yesterday’s low at $0.303 the price of Ripple's XRP has increased to $0.3181 at its highest point today which was an increase of 4.78% but since then it has pulled back and is currently sitting at $0.30755.
 Click to see the full-size image.
Looking at the zoomed out hourly chart you can see that today’s increase has led the price to breakout from the falling wedge in which it was correcting since the 24th of December and is currently interacting with the resistance line from the upside as it is testing it for support before it could continue the increase to the upside if the projection is valid.
As my target is around the 0.786 Fibonacci level but looking at the wave structure I have labeled the potential price pathway and have accounted the increase we have seen at the beginning of February as the start of that impulsive move. If the Minor correction ended and we are seeing the development of the Intermediate Y wave than the current movement is set to go past the prior high as the 3rd wave should develop.
If however, the price falls to continue its upward trajectory and goes back to the prior support and continues moving below it, then it would be likely that the Minor correction hasn’t ended and that the Y wave has yet to come.
Bitcoin Cash BCH/USD
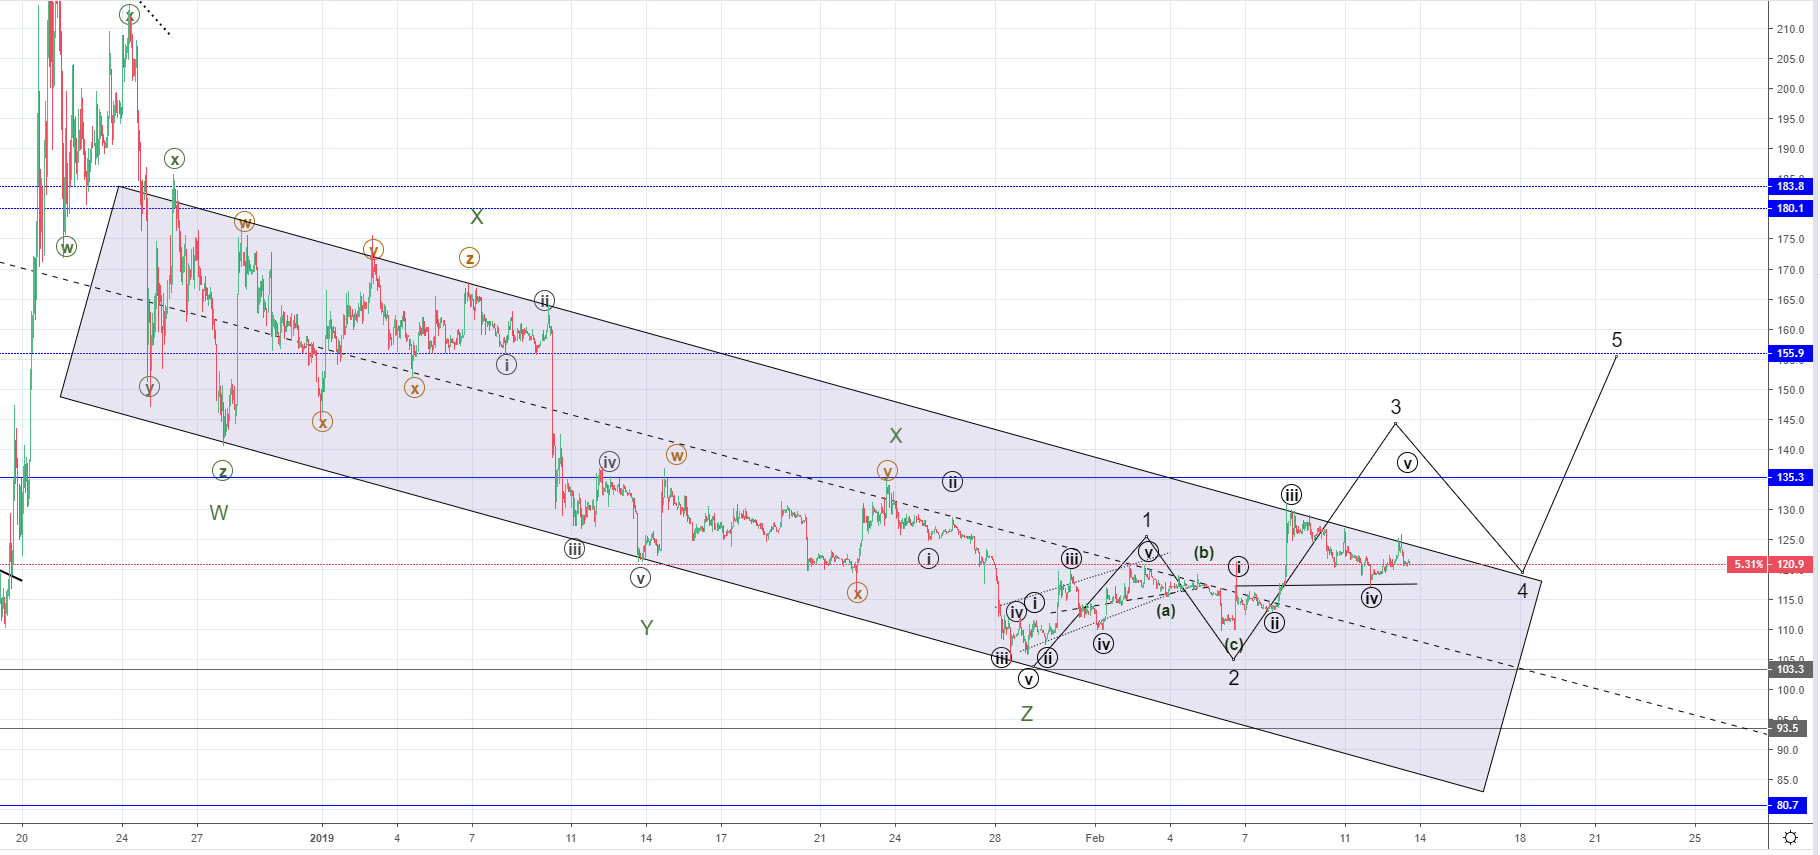
From yesterday’s low at $118.3 the price of Bitcoin Cash has increased to $124.3 which was an increase of 5.07% but since, it has fallen again and is currently sitting at $120.8.
 Click to see the full-size image.
On the hourly chart, you can see a similar situation like in the case of Ripple in the sense that the price is in its 3rd impulsive wave stage so if this is true then the price is likely heading for a breakout off of the descending channel on the upside very soon.
If not, we are seeing another retest of the descending channel’s resistance line before further downside as the correction inside it hasn’t ended. To validate each scenario the second Minute wave 4 which is the 3rd wave impulse will serve as an indication.
As the 4th wave cannot go inside the territory of the second wave according to the Elliott Wave Principle theory we are going to see if the horizontal support at $117.7 hold. If not and the price manages to go below it than the primary scenario will get invalidated.
To conclude all that has been said, my primary count remains and it is the one in which we are seeing the start of the Y wave but depending on what is going to happen in the following days we are going to see if it gets validated or not.
Current Crypto Market Overview:
 Click to see the full-size image.
Disclaimer: This analysis should not be taken as investment advice. DYOR: Do Your Own Research.
Publication date
Disclaimer
The views and opinions expressed in this article are solely those of the authors and do not reflect the views of Bitcoin Insider. Every investment and trading move involves risk - this is especially true for cryptocurrencies given their volatility. We strongly advise our readers to conduct their own research when making a decision.