Latest news about Bitcoin and all cryptocurrencies. Your daily crypto news habit.
Bitcoin BTC/USD Analysis
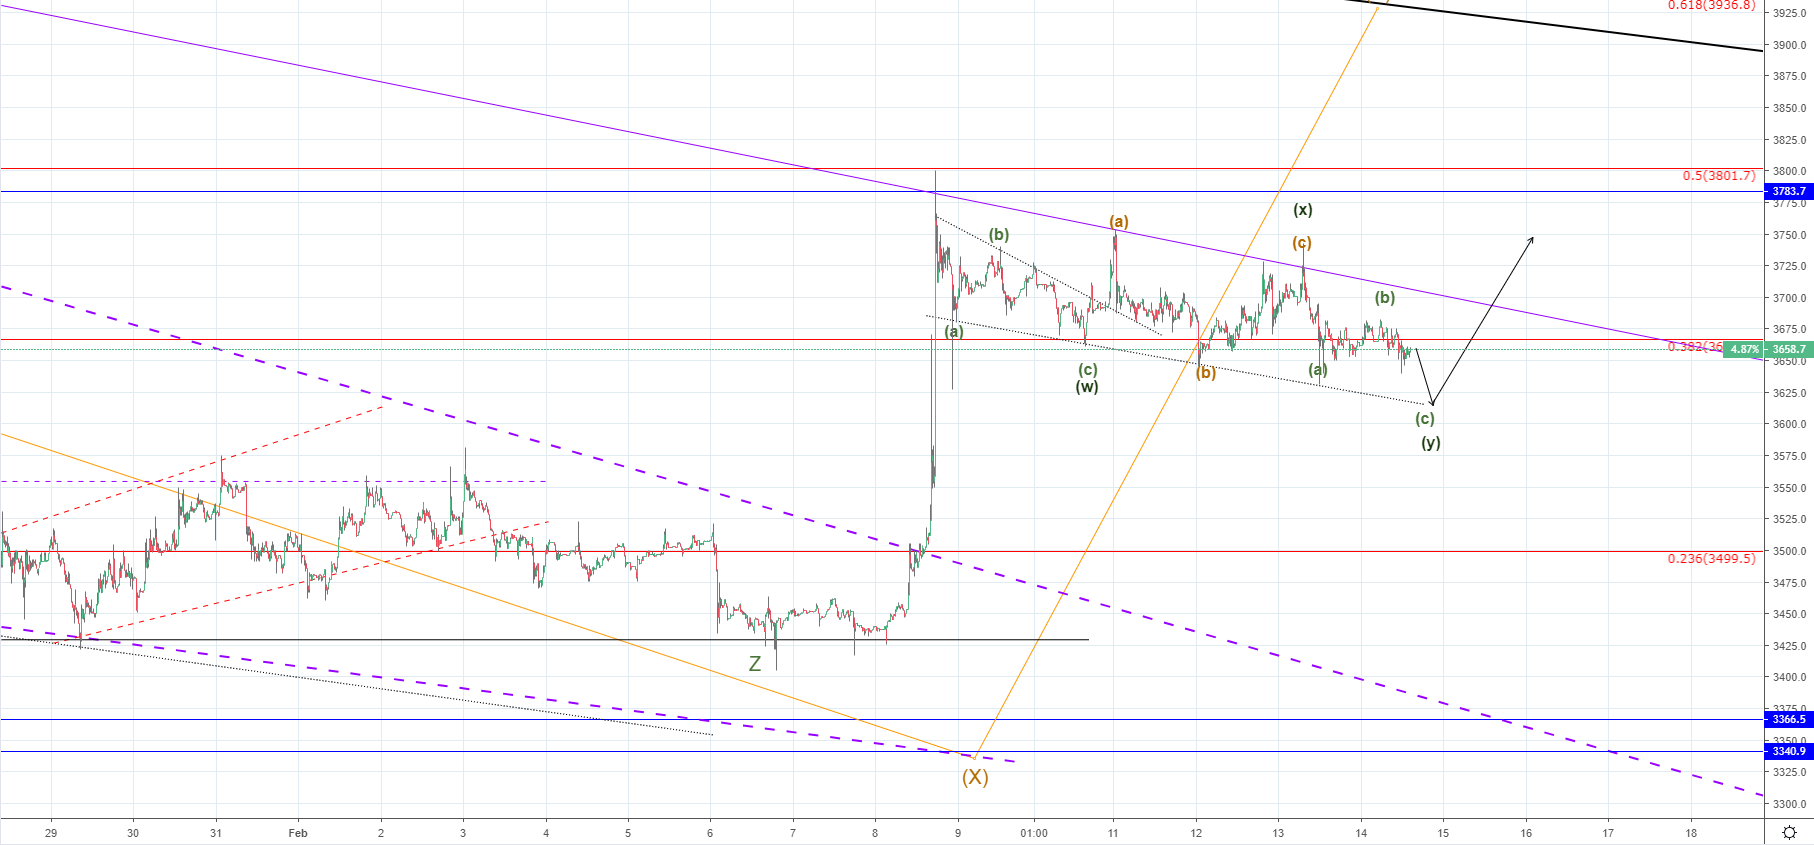
From yesterday’s open at $3687 the price of Bitcoin has increased at first to $3719.3 and fell from there to below the level of yesterdays open to $3652 at its lowest point today. The price is currently at $3658 which is an overall decrease of only 0.79% from yesterday’s open.
 Click above to see the full-size image.
Looking at the 15-min chart we can see that the price is still in a retracement zone which is turning out to be a descending channel. I have counted three ABC corrections out of which the current one is to the downside which constitutes a WXY of a higher degree.
As the price has been in an upward trajectory the descending channel is viewed as a retracement so after it ends more upside would be expected but before it ends we are most likely going to see some further sideways movement and a slight depreciation in price as the support needs to be established before the attempt to break the current resistance can be made.
If the price comes down again to the descending channels support that would be around $3615, but if it goes below the descending channels support we might see a decrease back to the 0.236 Fibonacci level at around $3500 area.
The price could crumble altogether if this increase was the continuation of the previous Minor WXYXZ correction although this is a lesser possibility. If that happens we are going to see a lower low compared to the now labeled Z wave which would, in that case, be the start of the Z wave, but for now, my primary count remains.
Ethereum ETH/USD Analysis
From yesterday’s open when the price of Ethereum was $125, we have seen a decrease of 1.41% as the price is currently sitting at $123.19. The price increased at first from the open and came up to the vicinity of the prior high at the 0.5 Fibonacci level where it retested the resistance and since it ended as another rejection that set the price in a more corrective movement to the downside.
 Click above to see the full-size image.
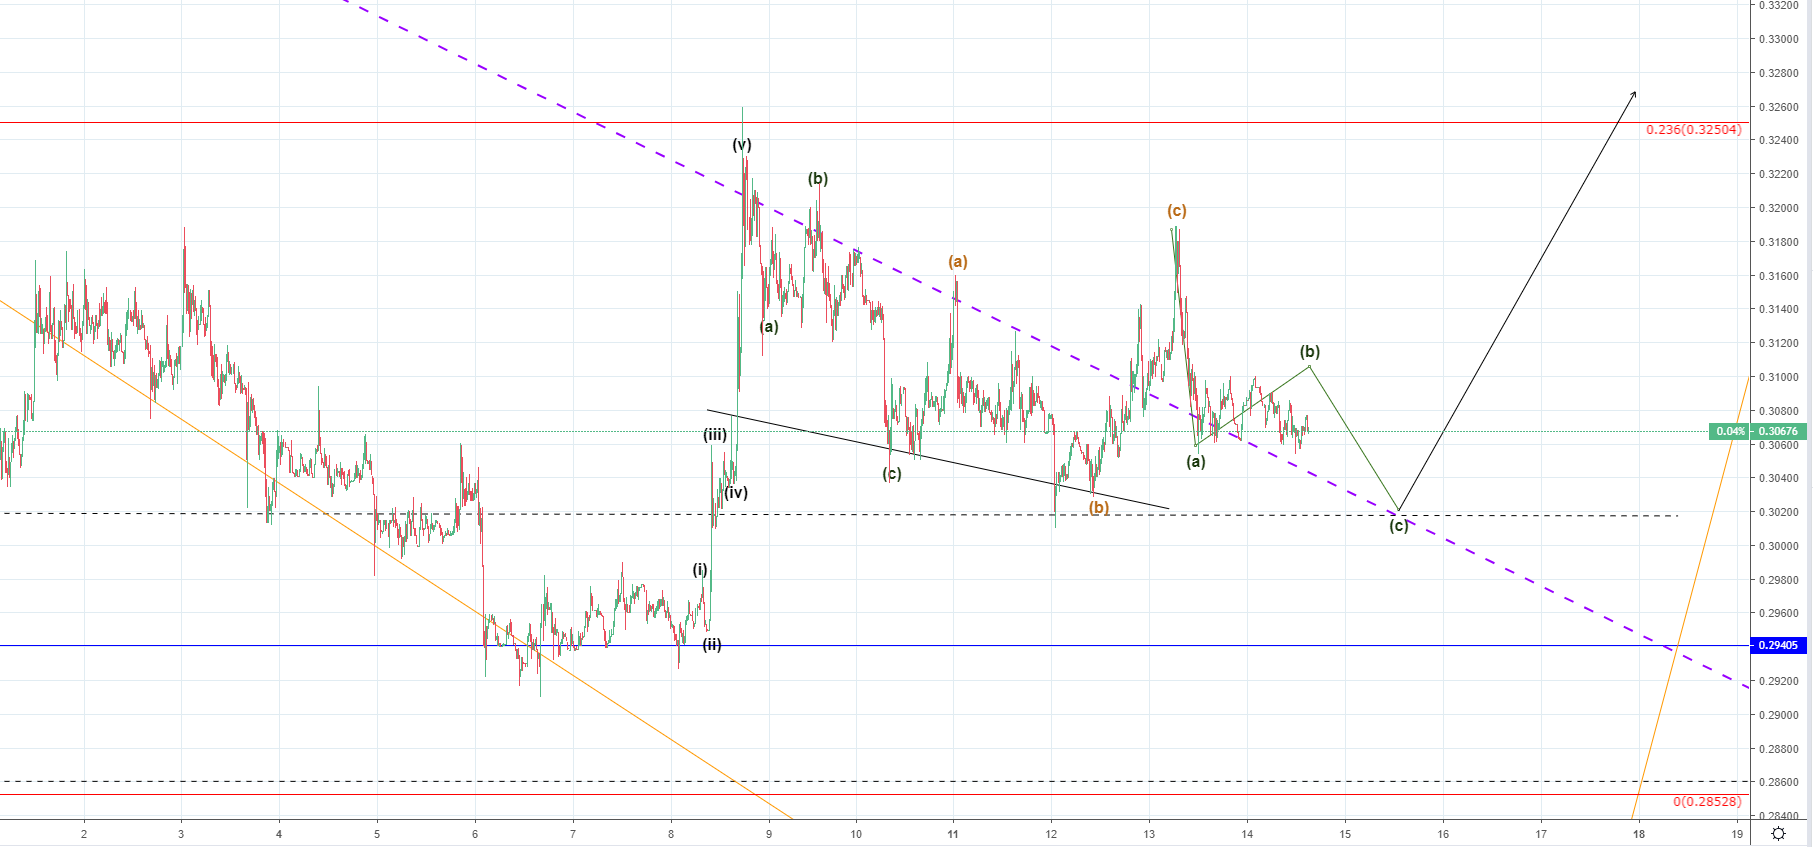
Looking at the 15-min chart you can see that the price has been experiencing sideways correction since the end of the impulsive move to the upside and similarly to the Bitcoin’s wave structure we have seen three consecutive ABC corrections with the price currently in the development of the third.
These three ABC corrections are probably the WXY of a higher degree count so another low would be expected from here as the last C wave should fully develop. The price target would be at the ending point of the Minuette W wave because the X wave has ended around its beginning so the correction would be a regular flat and is expected to end at $121-120 area.
If the price continues moving lower the next target would be the 0.328 Fibonacci level, but if it goes lower than that I would consider invalidating my count as according to the current one this is a retracement before further uptrend continuation.
Ripple's XRP/USD Analysis
The price of Ripple has decreased by 3.88% from the highest point yesterday at $0.319 measured to the level on which the cryptocurrency is currently being traded which is at $0.3072.
 Click above to see the full-size image.
On the 15-min chart, we can see that the price is still outside the territory of the falling wedge in which the price of Ripple as correcting since 24th of December like the other cryptos and is probably looking for support there around the levels of the prior resistance.
The price action has formed two ABC corrections and is likely forming now the third one which would retest the intersection of the falling wedge and the horizontal support level at $0.30177 before finally continuing its upward trajectory.
If the price goes lower than the mentioned level it might go back to the resistance line of the prior horizontal range from where the increase was made which would be at around $0.29757 but as strong momentum has been shown previously and the price is still outside the territory of the falling wedge I think that its more likely that a breakout occurred and that we are seeing the development of the Intermediate Y wave to the upside.
The price is now going to show us if the scenario gets validated or as we are going to see that from the current retracement – if the price finds support and continues moving to the upside again that would very likely mean that we are going to see further upside, but if the price enter the territory of the falling wedge again we are likely to see a lower low.
Bitcoin Cash BCH/USD Analysis
From yesterday’s high at $124.3 the price of Bitcoin Cash has been decreasing and is currently sitting at $120.3 which is a decrease of 3.31%.
 Click above to see the full-size image.
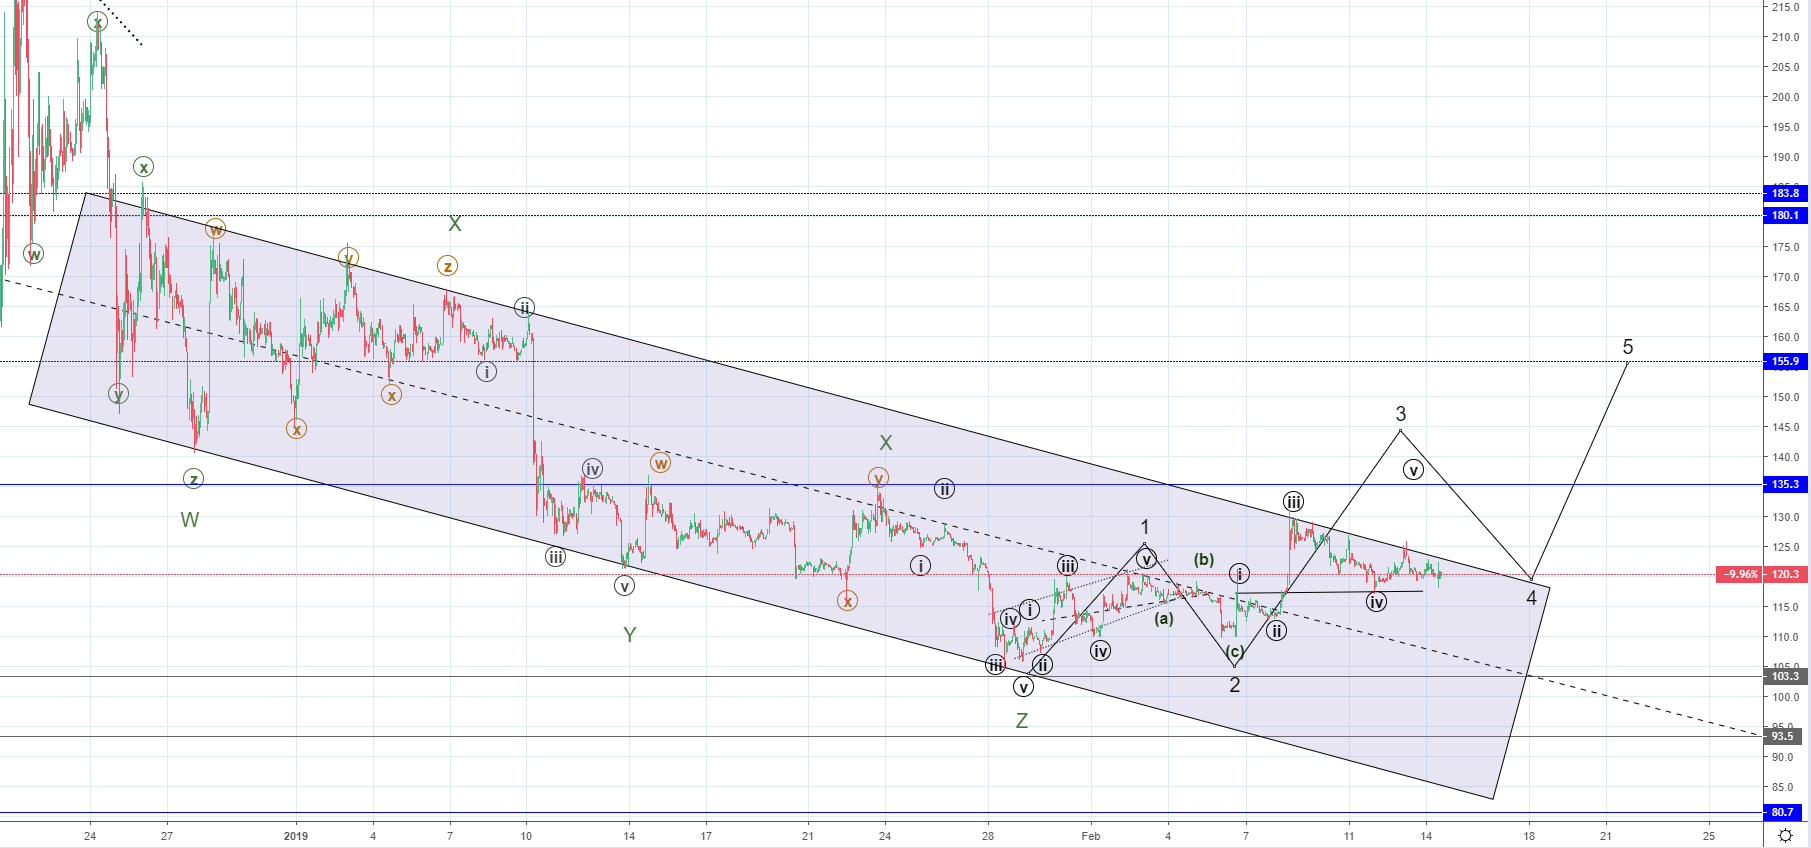
Looking at the hourly chart we can see that things haven’t changed much as the price is still inside the territory of the descending channel in which it is correcting since the 24th of December. According to my count, the Minor correction inside the mentioned structure has ended which is why the increase that started on last Friday is considered as the start of the impulsive move to the upside.
If this is true then the price of Bitcoin Cash can go below $118-117 area as it is the territory of the 2nd wave, so the level is serving as an indicator of validity. The price is currently in a retracement which is putting pressure on the descending channels resistance line so if my count is correct we are soon to see a breakout to the upside.
Like in the case of other cryptos this increase that we have seen started on Friday could be the prolongation of the Minor WXYXZ correction and if that is true than another low would develop as the Z wave hasn’t ended.
The expected increase’s target would be at $155 but that would only be the first target as if this is the start of the impulsive Intermediate wave Y we could see the price much higher.
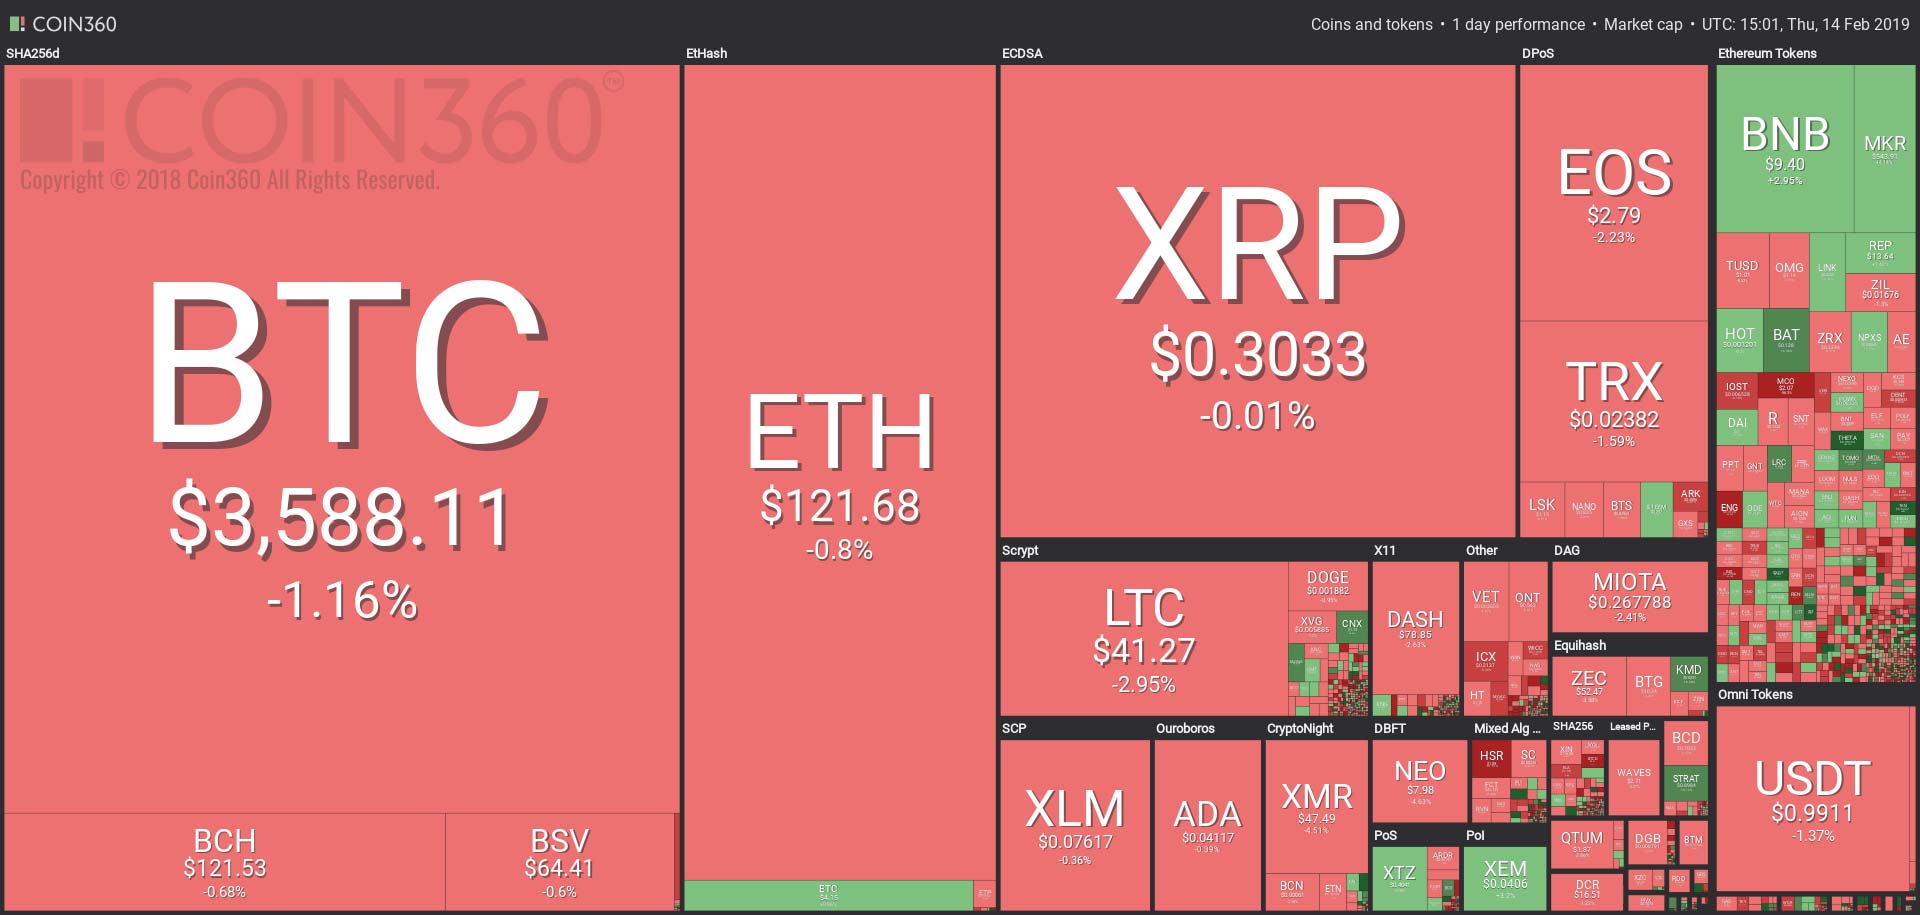
Current Crypto Market Overview:
 Click above to see the full-size image.
See this week's previous top crypto analysis:
- Bitcoin (BTC), Ethereum (ETH), XRP (Ripple), and BCH Price Analysis (Feb 11th)
- Bitcoin (BTC), Ethereum (ETH), XRP (Ripple), and BCH Price Analysis (Feb 12th)
- Bitcoin (BTC), Ethereum (ETH), XRP (Ripple), and BCH Price Analysis (Feb 13th)
Disclaimer: This is not investment advice. Do your own research.
Publication date
Disclaimer
The views and opinions expressed in this article are solely those of the authors and do not reflect the views of Bitcoin Insider. Every investment and trading move involves risk - this is especially true for cryptocurrencies given their volatility. We strongly advise our readers to conduct their own research when making a decision.