Latest news about Bitcoin and all cryptocurrencies. Your daily crypto news habit.
A set of six steps that can help you scrape a website and generate candlestick charts.
Yes! Anything that you see on any website can be scraped. From searching a house for rent to analyzing stocks, web scraping make things easy. You can extract data as and when you wish and use it for your need.
In this blog I will walk you through the six steps that I followed to scrape the website of National Stock Exchange and analyze the data using candlestick charts. Let’s get started with some definition now.
What is web scraping?
Web scraping or web harvesting is a technique used to extract data such as weather reports, market pricing or any data that you wish, from different websites across the web.
I find using APIs simple, compared to using web scraping. If you can find an API well and good, there is no need for web scraping. The important point here is that not all websites provide APIs so that’s where web scraping comes into the picture.
Prerequisites :
A. Prerequisites for web scraping :
Since we would be scrapping a website, it is important to have a basic knowledge of HTML, JavaScript and, of course, python.
B. Choosing the IDE:
In due course of the implementation of an idea, you might want to install various modules and packages. Therefore, choosing a good IDE is actually a very important step.
I used Anaconda distribution for my implementation. I choose the Spyder IDE because it comes with a lot of packages built-in. Installing packages is also pretty easy.
If you prefer to implement your idea using an online IDE, I would recommend you to use Repl.
C.Installations :
If you are using anaconda (click here to download), you can use the following commands to set up the mpl_finance module.
First of all, check for your pip version using pip --version. If your pip needs to be updated then, use python -m pip install --upgrade pip to update.
To install mpl_finance module, use the following command.
pip install https://github.com/matplotlib/mpl_finance/archive/master.zip
If you choose to run the code on repl, then no worries! All the packages get installed during the runtime.
Implementation:
Go through the HTML structure of the webpage that you wish to scrap.
Step 1. Understanding the URL:
As we all know, a URL acts as an identifier to a particular resource on the internet. It has various components like scheme name, hostname, port number, path, query string, and a fragment identifier. To brush up your knowledge on this may have to refer to this link.
The URL for the web page that we would be scrapping is
While we look at the URL we see the word called “symbol”. The key here is that, if we pass the symbol of the security of our choice, we get the corresponding page for that security.
Step 2. Making a HTTP request:
To access the web page, we need to first send a HTTP request. This can be done with the help of a python library called “requests”. There are a lot of features, that this library provides, like Keep alive and connection pooling, Session with cookie persistence, streaming download, connection timeouts, etc. There are a number of errors and exceptions that the request library can handle.
- ConnectionError exception: This is raised when there is problem with the network. For example, in the case of refused network or DNS failure this exception is raised.
- HTTPError exception: This is raised when the HTTP response is invalid.
- Timeout exception: This is raised when the request time is out.
- TooManyRedirects exception: If the request exceeds the preconfigured number of maximum redirections.
More information about the library and its methods can be found here.
The Requests library, can be imported by using import requests .You can use this library to send a HTTP request by passing the URL to it. Then you can get the contents from the page.
headers={“Referer”:”https://www.nseindia.com","Host":"www.nseindia.com","DNT":"1"} page = requests.get(URL, headers = headers)If you have this done, then it’s time to extract the soup.
Step 3. The role of BeautifulSoup:
BeautifulSoup is a python library that is designed for quick turnaround projects like screen scraping. You can import BeautifulSoup by using
from bs4 import BeautifulSoup
When you pass a page through BeautifulSoup it gives us a BeautifulSoup object, which represents that document, as a nested data structure.
cont = page.content soup = BeautifulSoup(cont,’html.parser’)
The structure of the soup extracted looks somewhat like this,
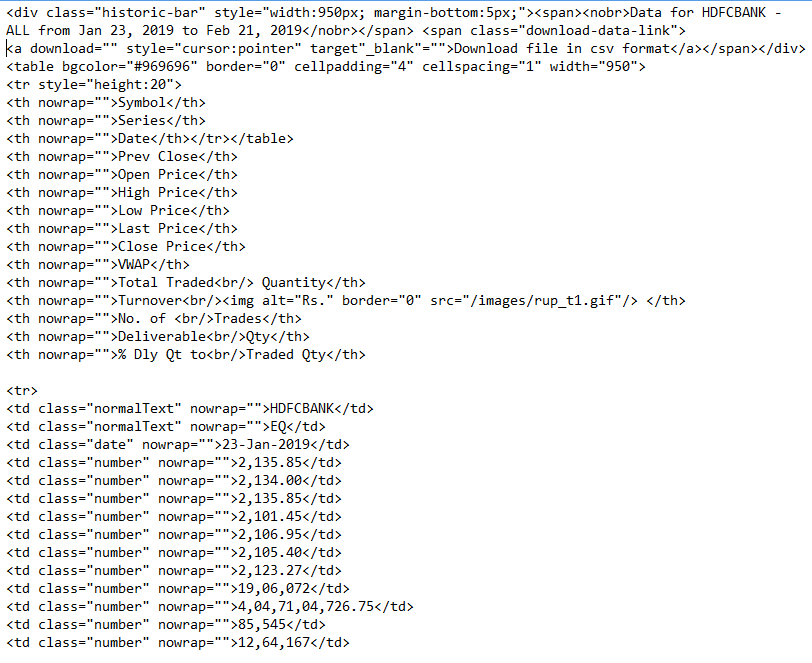
Step 4. Data extraction:
Since, we have passed the desired symbol name to the URL function, from which website extract the corresponding page, the soup that we have got using the previous step gives us the required data in a structured format.
Looking at the structure of the soup (A part of it is shown above) we get to know that we have to find all the table data or to in each of the table row or tr. After finding it we can store it in a python dictionary with the table header as the key. So essentially,
- We first extract the soup.
- We find all the ‘th’ or the table header and append the contents in the header_array.
- Next, we find all table rows using soup.findAll(’th’)and then you find the data in each row using .findAll(’td’).
- We are then trying to store the extracted data in a JSON format.
 You must be feeling somewhat like this after you extract your data :P
Step 5. Storing the data in CSV:
Storing the data is very important as it can be used for any referential purpose in the future. Although the data can be stored in JSON format, stock data is generally stored in the CSV format. So this is how it can be done,
Step 6. Understanding & generating Candlestick charts :
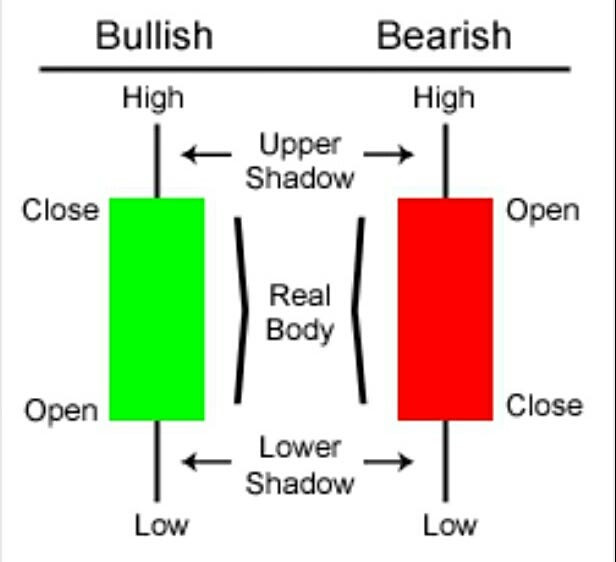
What are candlestick charts and why are they important?
Candlestick chart is a kind of financial analysis chart, that carries information about open, high, low and close prices for a security, derivative or currency. Each candlestick carries information pertaining to a particular trading day.
 The “Candlestick” function:
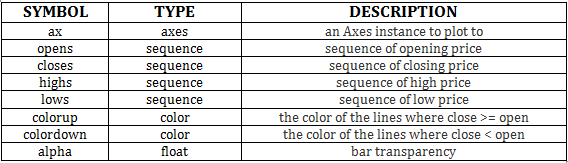
Candlestick chart can be generated using the candlestick_ohlc function. A basic candlestick function should look somewhat like this,
candlestick_ohlc(ax, opens, closes, highs, lows, width=4, colorup=’k’, colordown=’r’, alpha=0.75)
For more information regarding candlestick_ohlc, you can refer this link.
Instead of passing open, high, low and, close price separately, we can pass a list of tuples containing opening price, high price, low price and closing price for each day to the candlestick_ohlc function. Along with that, we would be passing other parameters required to plot the chart.
Date issues :
The x-axis of our plot will be date. We would be passing the date to the candlestick_ohlc function. So it is important to pass the information with the appropriate data type and format.
First, import datetime using from datetime import datetime
You might encounter this error saying a non datetime object is passed to a datetime axis. This can be tackled by using this.
datetime_object = datetime.strptime(’2018-10–09’,’%Y-%m-%d ’)
In addition to converting a string into datetime object, you might as well want to convert it to a format of your choice. It can be done using strftime.
datetime.datetime.strptime("1996–10–25", '%Y-%m-%d’).strftime(’%m/%d/%y’)Therefore to sum up,
strptime converts the string to datetime object.
strftime creates a formatted string for a given datetime object according to the specified format. This link contains the details about various formats that can be used in strftime.
“Thou shalt not overlook the data type and format of the date that thou art passing”
The complete code!
This link takes you to my Github page where you can view the entire code!
If you run this program successfully, viola! you must be seeing something like this for the security of your choice.
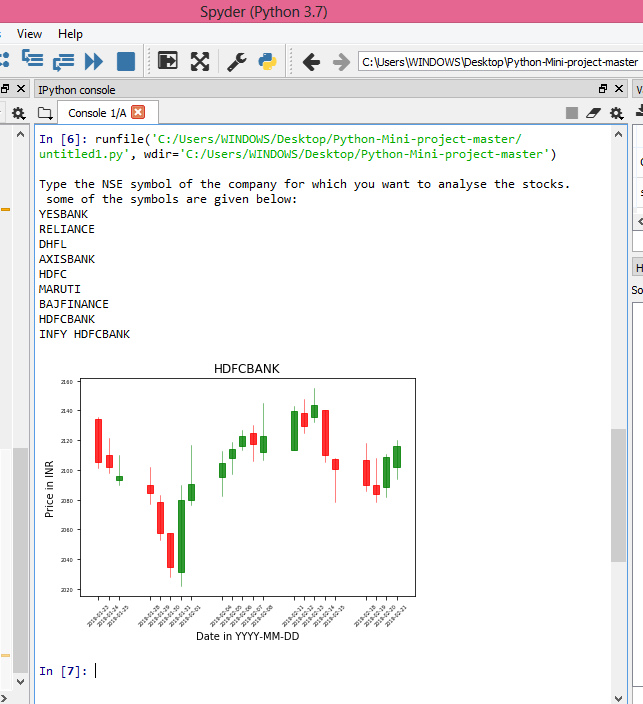 Candlestick chart for HDFC BANK
Data abstraction:
In this program, as I said, I have followed a modular approach. I have coded in such a way that if you make a call to the last program, one before the other, it backtraces its path by calling the previous program. The main reason for adopting this approach is that, though there are about 5 functions, most of them act as a utility. When we look at it from an end user perspective, the function of those isn’t required.
Abstracting codes into functions enhances readability and usability!
Conclusions and Extensions
- This program is capable of generating a candlestick chart and storing it in a .png format for the company that you enter. Apart from that, it can store the data in a CSV folder. To edit the path as per your wish to enjoy the results!
- A lot of exciting web scraping tools are available here! Depending on your requirements and availabilities you can choose the tool.
Hi, I’m Sruthi. This is my first shot at writing. I’m overjoyed on getting to know that you made it till here! If you enjoyed the post, press 👏 to support.
I would love to hear all of your views and suggestions. Comment them out in the comment section below!
If you can see it, you can scrape it! was originally published in Hacker Noon on Medium, where people are continuing the conversation by highlighting and responding to this story.
Publication date
Disclaimer
The views and opinions expressed in this article are solely those of the authors and do not reflect the views of Bitcoin Insider. Every investment and trading move involves risk - this is especially true for cryptocurrencies given their volatility. We strongly advise our readers to conduct their own research when making a decision.