Latest news about Bitcoin and all cryptocurrencies. Your daily crypto news habit.
Create dashboards easily using a Serverless framework
For the purpose of this article, we will get into the shoes of the owner of a newly created online casino. Our first game is roulette, and its backend is a serverless API on AWS. We will discover how we can get some metrics about our game.

The roulette API
Our API offers an endpoint that process players bets and returns a random integer between 0 and 36. You can achieve this really easily with a Serverless framework:
Our code is ready, and you can deploy it by running:
serverless deploy —-stage staging --region eu-west-3
Find the API URL in the deployment logs, and start playing by querying the API:
export CASINO_URL=https://xxxxxxxxxx.execute-api.eu-west-3.amazonaws.com/staging/roulette
curl -X POST $CASINO_URL -d '{"bet":50,"number": 13}' -H 'Content-Type: application/json'{"win":false,"result":12}Great, we have a working casino and thanks to our advertising campaign, players are starting to use it. In order for us to drive our next decisions, we need some business insight. In particular, we would like to know how the bet value evolves with time in the day. Our engineering team is already busy building a poker game, so we need something really quick to set up.
Good news, everyone! You can create that kind of custom metric/dashboard on CloudWatch, and there is even a serverless plugin to automate it. You will see that we don't even need to update our JavaScript code.
CloudWatch Metrics
Metrics are the fundamental concept in CloudWatch. A metric represents a time-ordered set of data points that are published to CloudWatch. Think of a metric as a variable to monitor, and the data points as representing the values of that variable over time. For example, the CPU usage of a particular EC2 instance is one metric provided by Amazon EC2. The data points themselves can come from any application or business activity from which you collect data. — documentation
In our case, we will create a custom metric: the bet value over time. We are already logging the request body, so here are our custom metric properties:
- Filter pattern: { $.bet = * }The syntax uses JSON path to filter on logs that we want to use for our metric. In our case, we are interested in logs printing the request body (including the bet property).
- Metric value: $.betStill using a JSON path, defines what property you want to keep as the metric value: in our case the bet value.
- Log group name: /aws/lambda/online-casino-staging-rouletteThis represents the source of data. We want our metric to show insight about our roulette game, but not about our new poker game. Also, don't forget to update the stage in the name.
You can get more information about filter and pattern syntax here.
Serverless Plugin Metric
Like for almost everything, there is a serverless plugin to automate custom metrics creation. First, install it and we will append a few lines to our serverless.yml to create the metric:
npm install --save-dev serverless-plugin-metric
CloudWatch Dashboards
Now that we configured our data source, let's create the dashboard. Append these lines into your serverless.yml:
A few notes:
- You can add many widgets in a dashboard. Each widget is composed of a configuration and a list of metrics. The same configuration will be used for every metrics in the same widget.
- The period property defines how often a value should be computed. Here we set 300 seconds (every 5 minutes).
- The stat property let you choose how values should be aggregated. For our first graph, we want the average bet value, so we used Average. For the second, we want the number of bets and we used SampleCount. Lastly, we will display the total bet amount in the period using Sum. Other possibilities include Minimum, Maximum, and various percentiles.
- Three different views are available:- "view": "singleValue" displays a single value- "view": "timeSeries" displays a line chart- "view": "timeSeries", "stacked": true displays a stacked line chart
- You can create your dashboard in CloudWatch console, and export widgets JSON definitions in the source tab when editing.
Result
After one hour of sending random values through the API, here is the result:
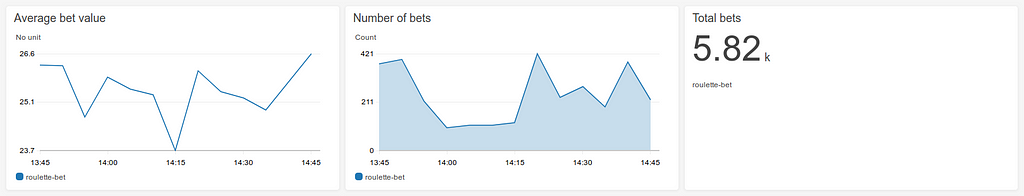 Our wonderful dashboard
Pretty good for the small amount of work required, don't you think? Oh, and here is the pricing:
- $3/dashboard/month
- $0.30/metric/month
Which makes $3.30 per month for this dashboard.
Bonus: Using widgets outside the console
One last thing: we would like to share these graphs with the executive board of the casino. But giving them access to the CloudWatch console doesn't seem like the thing to do. Well, you are lucky because there is an API for that: GetMetricWidgetImage. Instead of creating the dashboard in your serverless.yml, you can retrieve widget images from within a web app that the board has access to and you can keep the AWS console for engineers.
And voilà! Thank you for reading. Feel free to share your thoughts in the comments and happy dashboarding!
Custom business insight using built-in AWS features was originally published in Hacker Noon on Medium, where people are continuing the conversation by highlighting and responding to this story.
Publication date
Disclaimer
The views and opinions expressed in this article are solely those of the authors and do not reflect the views of Bitcoin Insider. Every investment and trading move involves risk - this is especially true for cryptocurrencies given their volatility. We strongly advise our readers to conduct their own research when making a decision.