Latest news about Bitcoin and all cryptocurrencies. Your daily crypto news habit.
Following our Thursday price analysis, Bitcoin had lost almost $1000 in one and a half days. This came straight after 3-4 failed attempts to break the $10,000 mark over the past two weeks.
When you’re not breaking, and the attempts are losing strength, you will dump hard. This was the bad news; however, the good news is that a long-term ascending trendline saved Bitcoin, as of now.
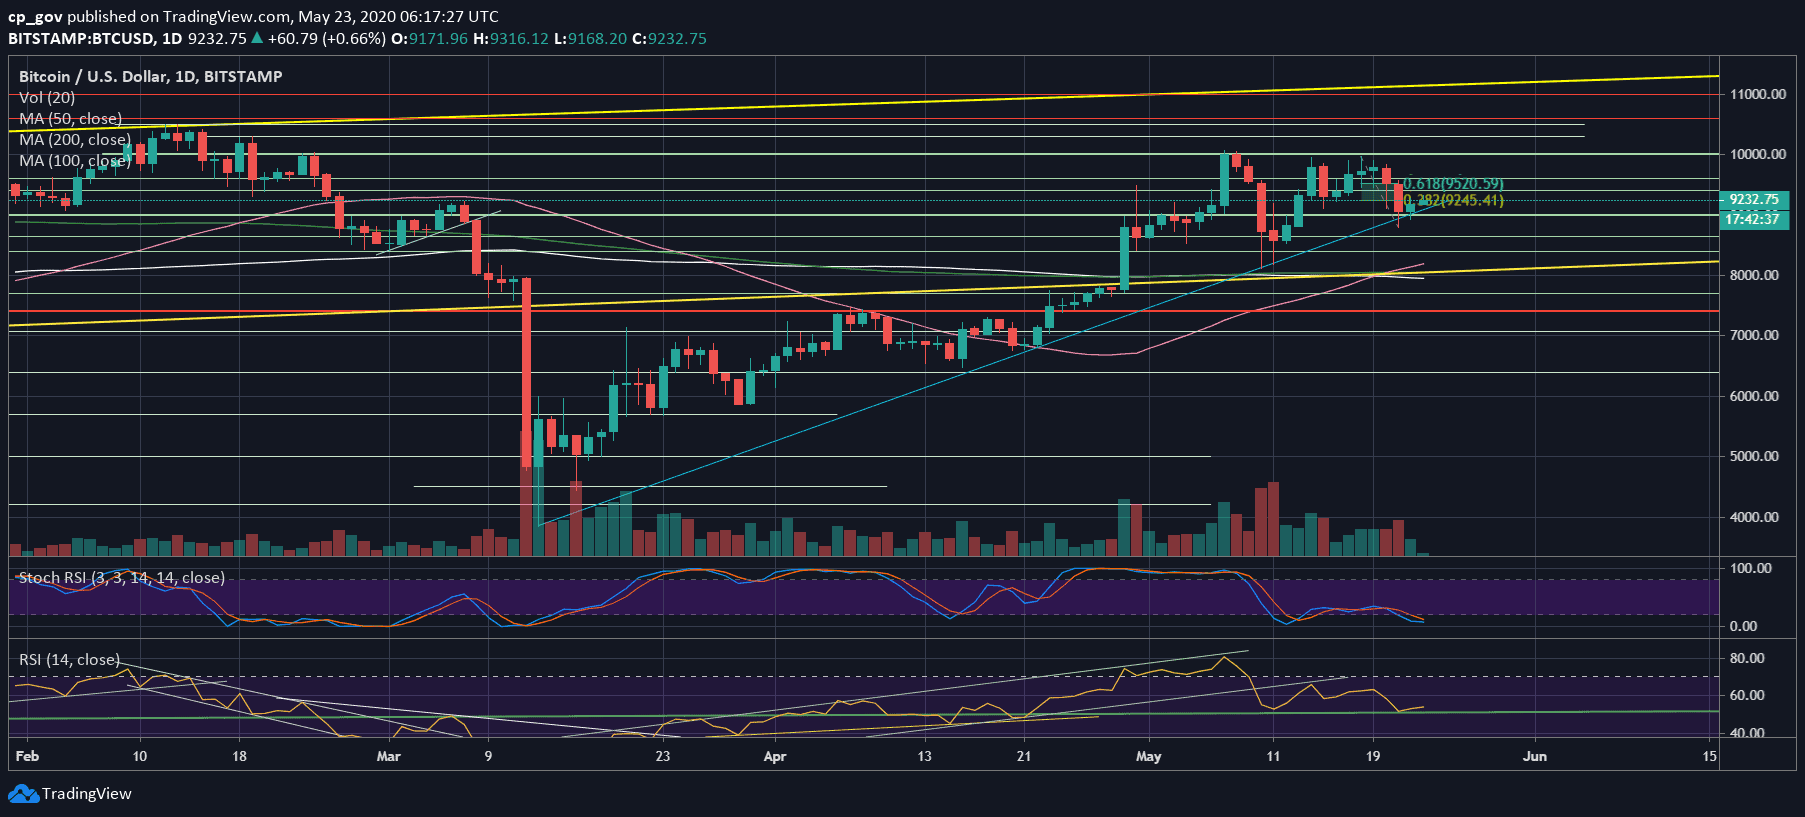
The ascending trendline, marked blue on the following daily chart, was started forming on March 12, 2020, when Bitcoin crashed over 50% to $3600. Yesterday, Bitcoin reached down to the line at $8800 – $8900 and quickly rolled back above the $9K region.
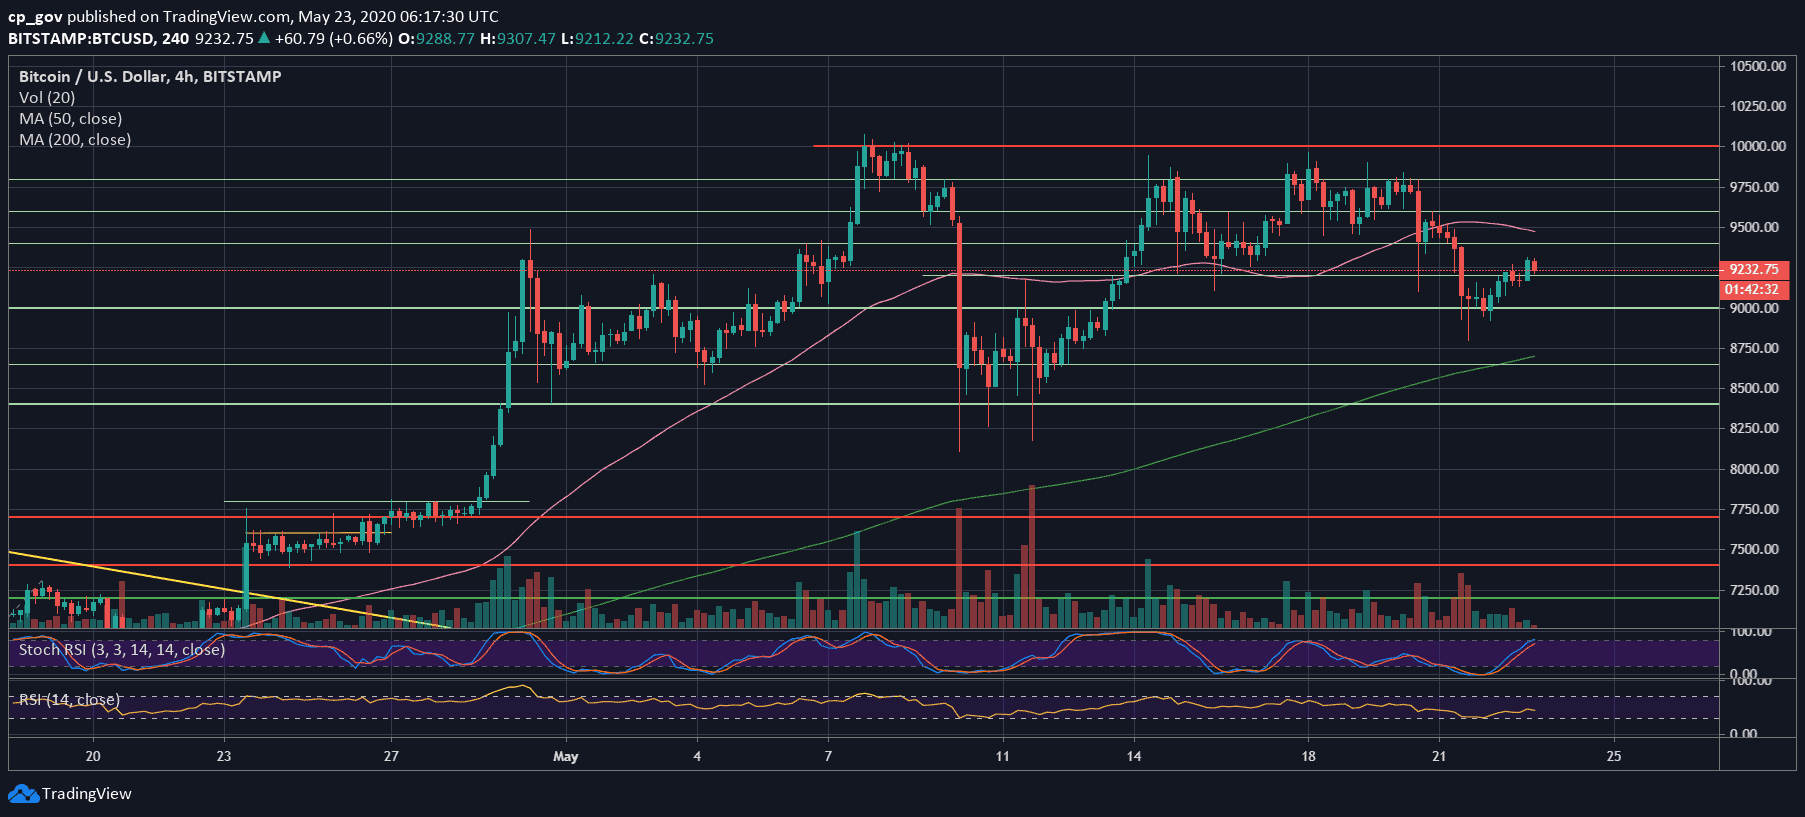
Over the past hours, we see Bitcoin consolidating between the range of $9200 – $9300, a region that served as strong support now becomes strong resistance. The area also contains the Fibonacci retracement level 38.2% following Thursday’s price decline.
Total Market Cap: $258 billion
Bitcoin Market Cap: $170.4 billion
BTC Dominance Index: 66.1%
*Data by CoinGecko
Bitcoin Short-term Support and Resistance Key Levels
As discussed above, Bitcoin is facing $9200 – $9300 as the first significant resistance level, as of writing these lines. In case Bitcoin fails here, then the first support would be the same ascending trend-line, which now lies around $9000.
This is followed by support levels at $8800, $8650, $8520, and $8400. Further down lies $8000 – $8200, the strong buy area, which also includes the three significant moving average lines – 50, 100 and 200 days.
From above, in case of a break-up, then the next level of resistance would be $9500, along with the Fib retracement level of 61.8%, $9600, and $9800.
The Technicals and Trading Volume
As discussed here on our previous price analysis, the RSI also encountered strong support at the 50 level. The support held firmly; however, not a lot had changed, telling by the momentum indicator.
Regarding the trading volume, after it was declining for the two weeks of the $10,000 tryouts, Thursday’s dump recorded the highest daily volume candle in 7 days. Not a bullish sign for Bitcoin, but too early to state.
BTC/USD BitStamp 4-Hour Chart
BTC/USD BitStamp 1-Day Chart
Enjoy reading? Please share:
Telegram
The post Bitcoin Price Analysis: The Critical March-12 Support Saved BTC, But Now Facing Huge Resistance appeared first on CryptoPotato.
Publication date
Disclaimer
The views and opinions expressed in this article are solely those of the authors and do not reflect the views of Bitcoin Insider. Every investment and trading move involves risk - this is especially true for cryptocurrencies given their volatility. We strongly advise our readers to conduct their own research when making a decision.