Latest news about Bitcoin and all cryptocurrencies. Your daily crypto news habit.
Bitcoin has surged $1,000 from last week’s lows of $10,400. At $11,400, the cryptocurrency remains decisively higher than it was before this rally. Even still, analysts think that Bitcoin is primed to undergo a reversal as its short-term to medium-term chart flashes a number of warning signs.
Bitcoin Could Face a Short-Term Pullback as Price Fails to Pass Breaker
One crypto-asset analyst recently shared this chart below. It shows that BTC’s recent rally ended right at a key “daily breaker level,” suggesting that the coin is “good for a pullback” in the days ahead.
As to what exactly he expects to happen, he thinks that Bitcoin will range between $11,700 and $10,700 for the foreseeable future, as that’s where crucial technical levels lie.
Commenting on the specifics of the chart, the analyst who shared it wrote:
“Price tagged bearish daily breaker confluent with EQ As good as price looks for a pullback Id say we range between these levels a bit longer to properly distribute Poor highs around Monday’s high so areas for dips are the H6 breaker and shorts on a sweep.”
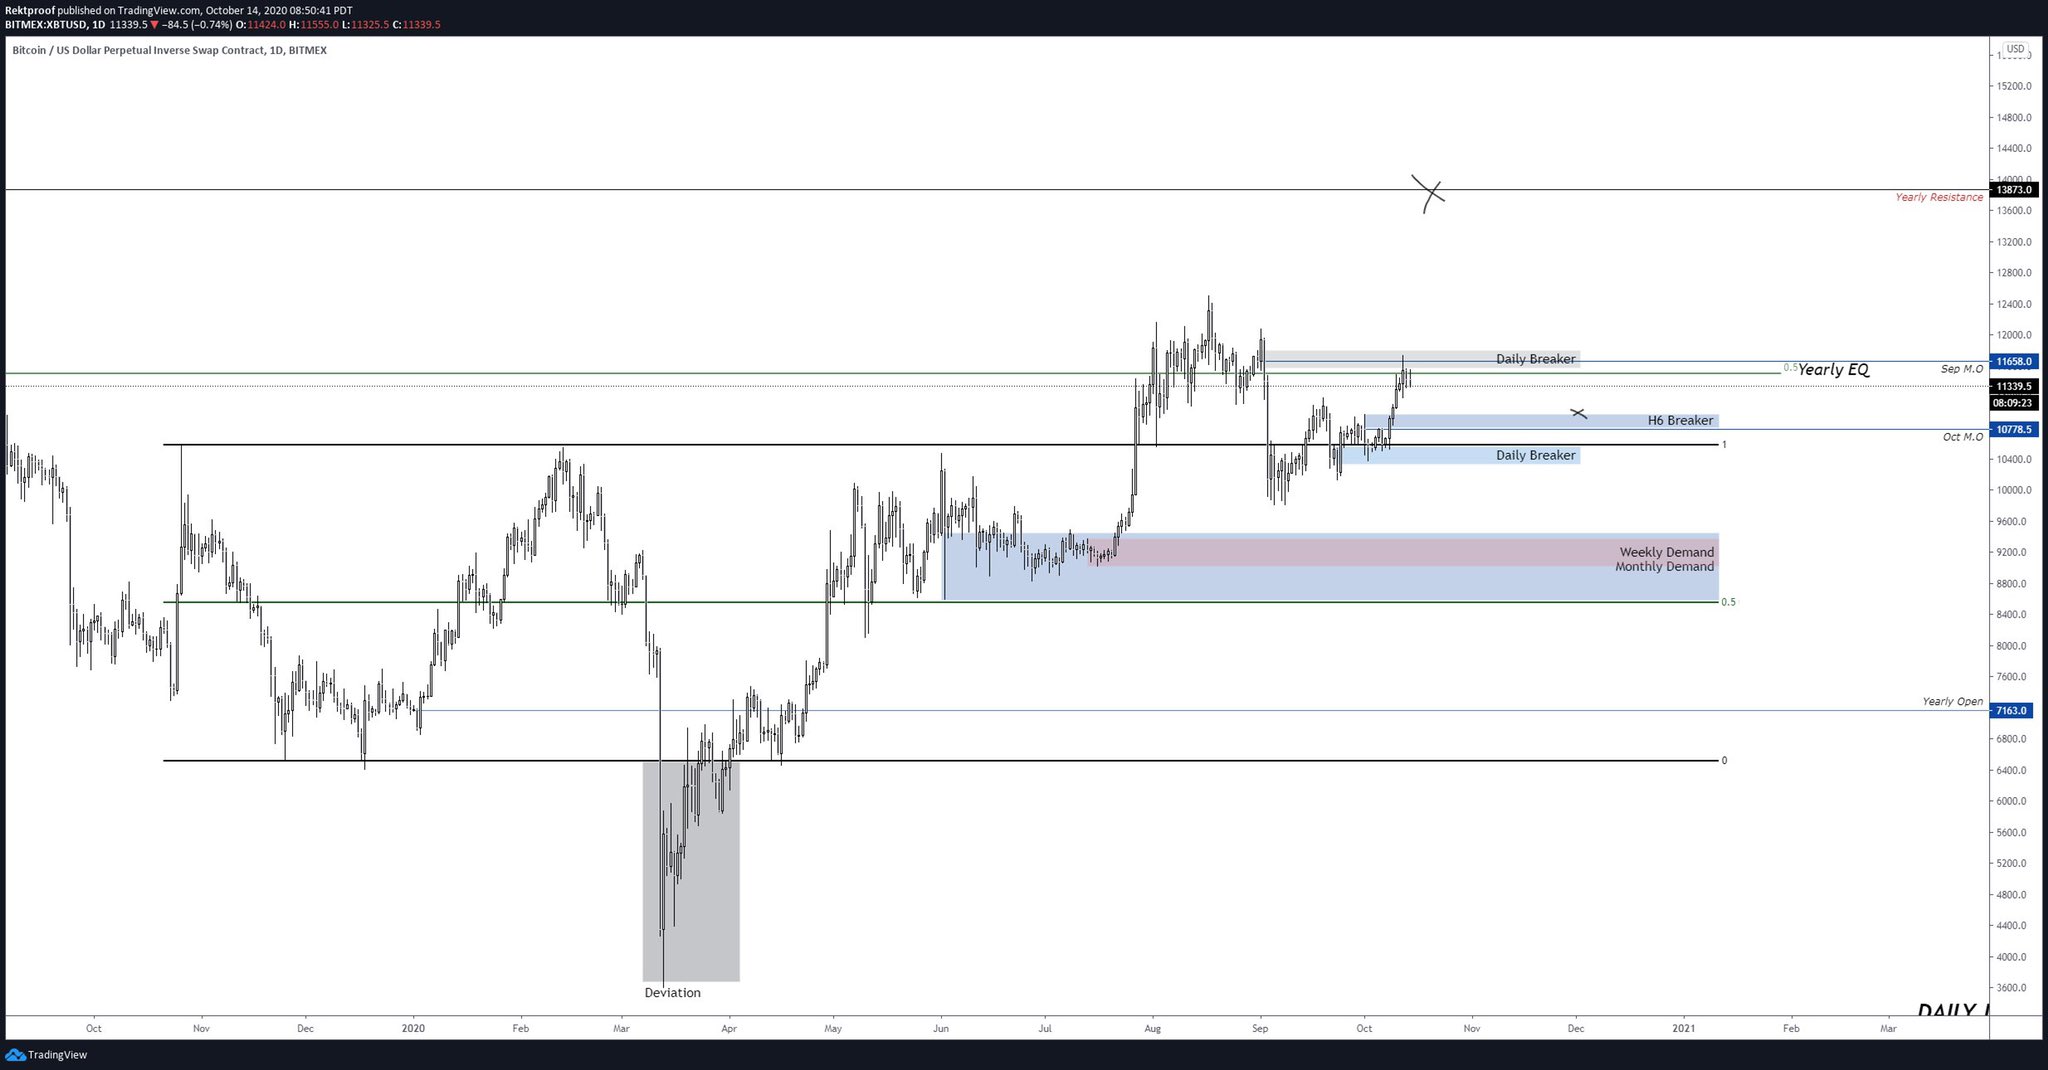
Chart of BTC's price action over the past 12 months with analysis by crypto  trader Rekt Proof (@RektProof on Twitter).
Source: BTCUSD from TradingView.com
Bitcoin could slide towards $11,100 in the days ahead as it faces a CME futures gap at that level. 75% of CME BTC futures gaps fill within the week they open.
Macro Trend Still Favoring Bulls
The macro trend still favors bulls despite Bitcoin’s short-term weakness and potential for downside.
Tyler Winklevoss, a co-founder of Gemini, recently said that any push for further inflation of the U.S. dollar and fiat currencies will prove Bitcoin’s value:
“Stonks love nothing more than wen the money printer goes brrrr like an A-10 warthog. It’s full-fledged addiction that’s not going to end until it has to. When that will happen is hard to predict, but what’s certain is that #Bitcoin will b your only refuge.”
Technical trends favor bulls as well.
One crypto-asset analyst recently pointed to three key reasons why the macro trend for Bitcoin is still favoring long-term growth. These include Bitcoin flipping a macro $10,000 range into support, BTC breaking above a critical long-term trendline, and BTC retracing to a golden pocket Fibonacci Retracement on a macro time frame.
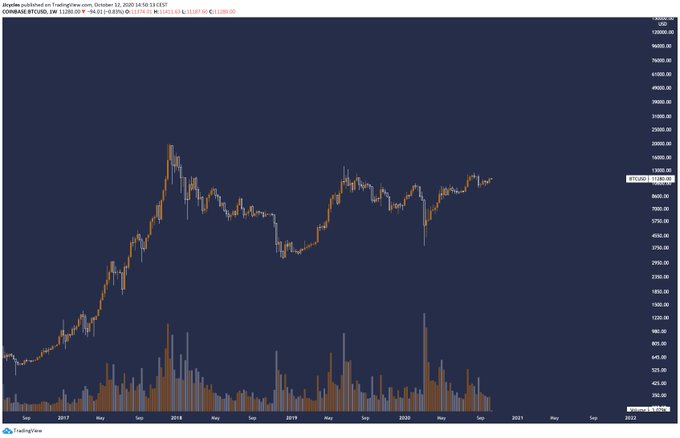
Chart of BTC's weekly chart since the middle of 2016 with analysis by crypto trader JJCycles (@jjcycles on Twitter).
Source: BTCUSD from TradingView.com
Photo by Paweł Czerwiński on Unsplash
Price tags: xbtusd, btcusd, btcusdt
Charts from TradingView.com
Bitcoin "Looks Good" For a Pullback as Price Fails to Pass Key Level
Publication date
Disclaimer
The views and opinions expressed in this article are solely those of the authors and do not reflect the views of Bitcoin Insider. Every investment and trading move involves risk - this is especially true for cryptocurrencies given their volatility. We strongly advise our readers to conduct their own research when making a decision.