Latest news about Bitcoin and all cryptocurrencies. Your daily crypto news habit.
After last week’s excitement of a brand-new Bitcoin all-time high, the bulls forgot about the strong resistance at the key level of $20,000.
According to the basics of technical analysis, just as in soccer, if you do not break above – you lose force and regress. This is exactly what we see over the past two days, following another failed attempt at the $19,500 – $20K zone.
Since then, the Bitcoin price is going through a blood bath. The primary cryptocurrency had lost almost $2000 off its value over the 48 hours, as of writing these lines.
BTC Support and Resistance Levels To Watch
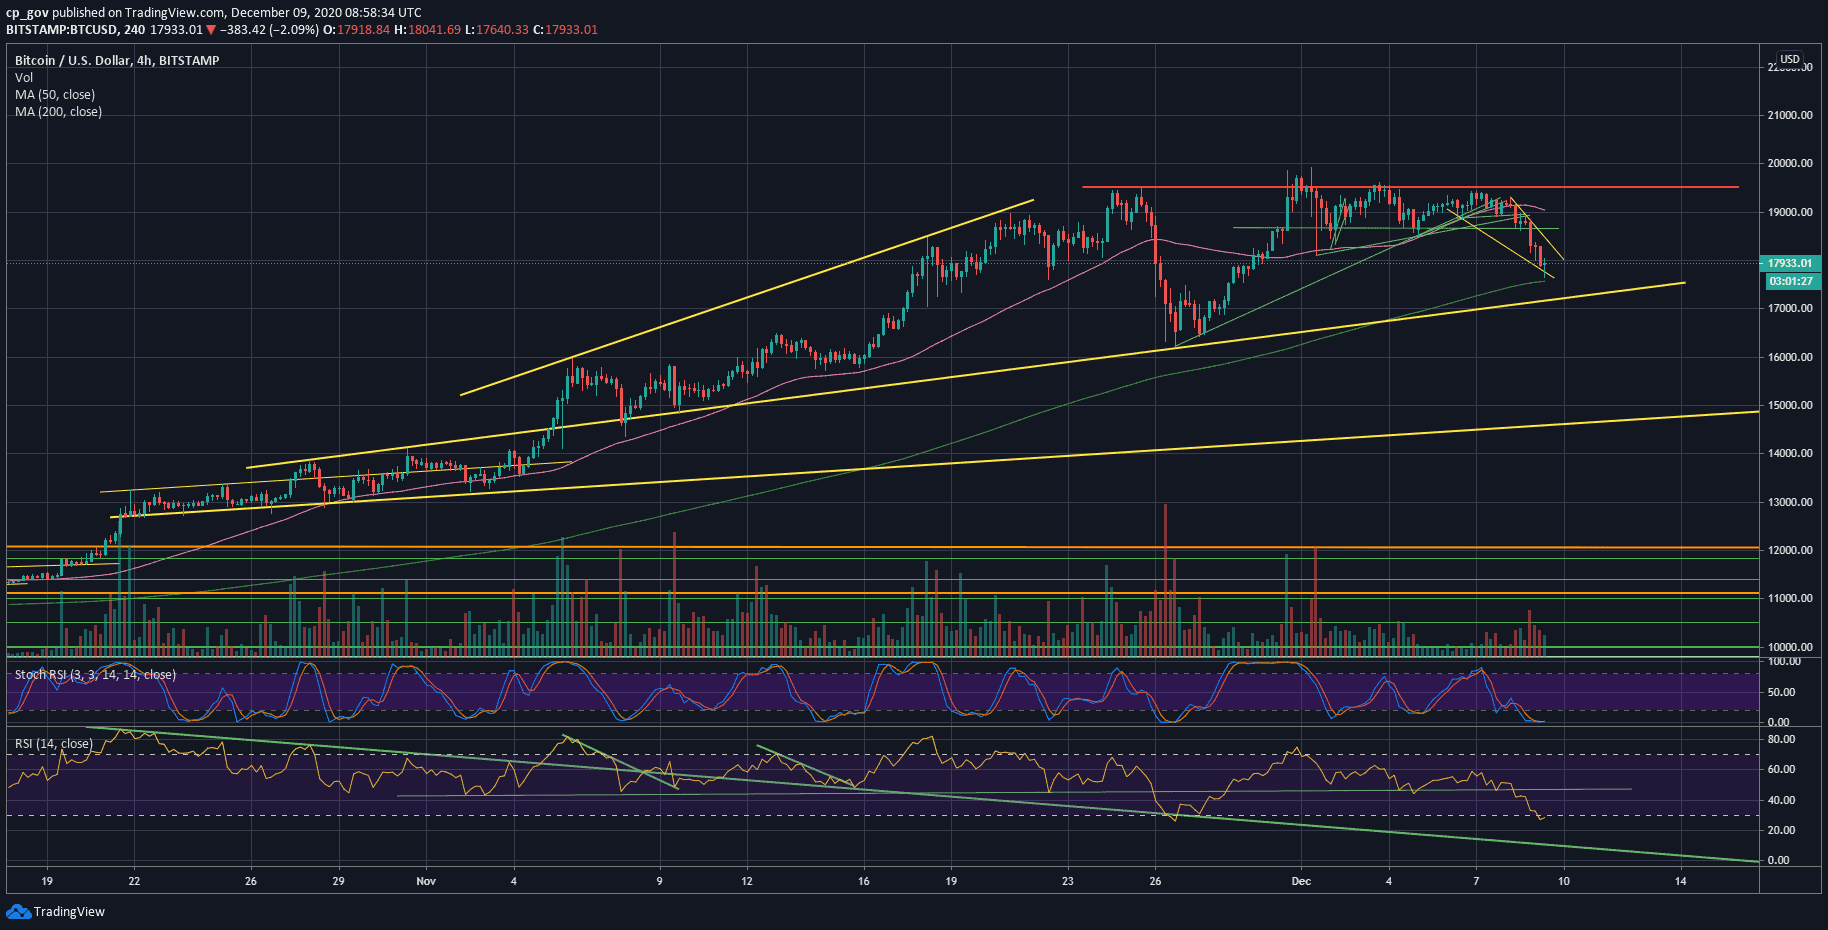
Looking at the following 4-hour chart, we can identify that since losing the critical support line at $18,700, Bitcoin’s price started plunging.
As of now, the 4-hour chart’s MA-200 line (marked light green), along with horizontal support of $17,560, could be the first significant level of support.
In case Bitcoin breaks it, the next possible major level of support is the mid-term ascending trend-line at around $17,250 – $17,300. The line was started forming in October.
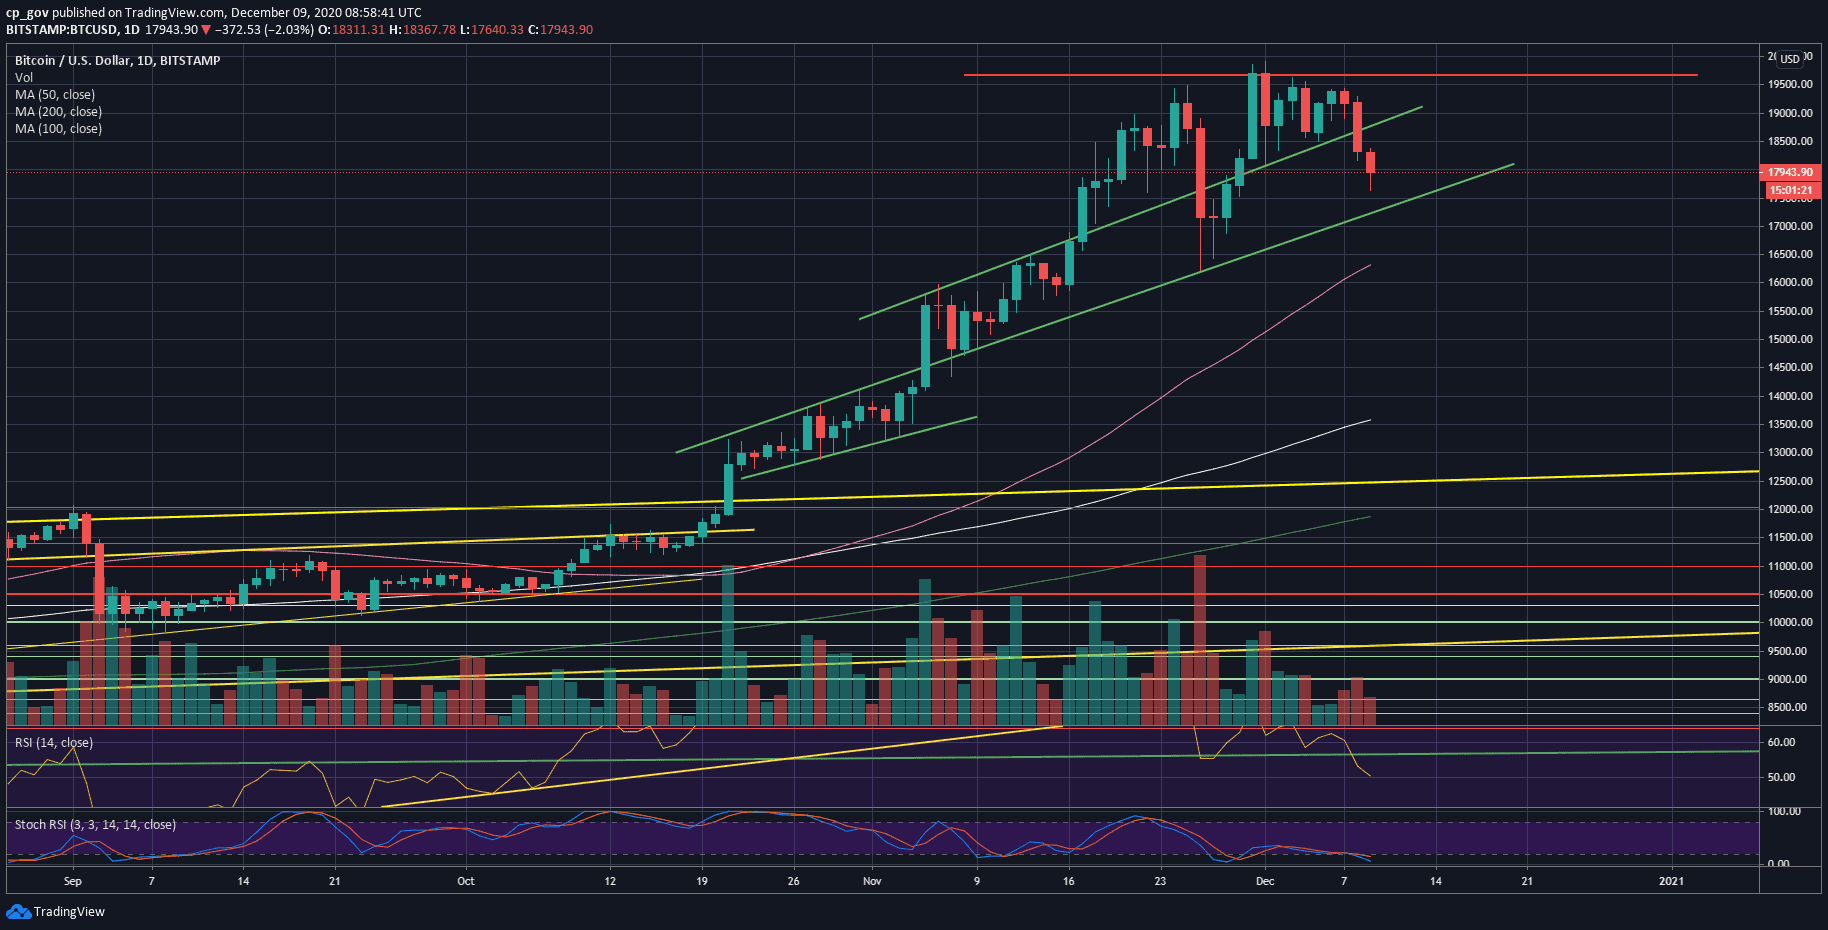
Further below lies $17,000, which is an open CME Futures gap, before $16,500 and the 50-days moving average line (marked by pink on the daily chart) at $16,300.
On the other hand, the RSI is getting to the oversold zone both on the daily and the 4-hour chart. The daily RSI is at its lowest level since October 2019.
In case that support holds, then the first level of support turned resistance is the $18K area, along with a short-term descending trend-line (yellow on the 4-hour chart). This is followed by $18,500 and $18,700 (the critical level mentioned above).
However, the major obstacle is still the all-time high area of $19,500 – $20K. There is a huge amount of resistance there. In case that Bitcoin finally breaks it, I expect a quick move to $22K.
Total Market Cap: $532 billion
Bitcoin Market Cap: $331 billion
BTC Dominance Index: 62.3%
*Data by CoinGecko
BTC/USD BitStamp 1-Day Chart
BTC/USD BitStamp 4-Hour Chart
Publication date
Disclaimer
The views and opinions expressed in this article are solely those of the authors and do not reflect the views of Bitcoin Insider. Every investment and trading move involves risk - this is especially true for cryptocurrencies given their volatility. We strongly advise our readers to conduct their own research when making a decision.